The package DESeq / DESeq2
What can `DESeq’ do?
- Identify differentially expressed genes (DEG’s)
- DESeq @ Bioconductor (includes vignette)
- R documentation chapter
- Publication
Loading the library
# source("https://bioconductor.org/biocLite.R")
# biocLite("DESeq")
suppressMessages(library(DESeq))
Loading count data from RNA-Seq
counts = get(load("counts_Hs.RData"))
dim(counts)
## [1] 27704 6range(counts)## [1] 0 899348is.matrix(counts)## [1] TRUEhead(counts)## A1 A2 A3 B1 B2 B3
## ENSG00000101557 2590 2647 3225 3173 3147 3515
## ENSG00000079134 487 488 570 565 663 677
## ENSG00000261724 10 10 14 4 10 9
## ENSG00000158270 13565 14006 16451 9602 9823 10311
## ENSG00000079101 29 23 44 16 20 16
## ENSG00000176912 4 9 5 14 10 20conditions = get(load("conditions_Hs.RData"))
conditions## [1] "10mM" "10mM" "10mM" "0mM" "0mM" "0mM"length(conditions) == ncol(counts) # must be TRUE## [1] TRUElength(unique(conditions)) == 2 # simple analysis: just compare two conditions ## [1] TRUEnr.replicates.group1 = sum(conditions == unique(conditions)[1])
nr.replicates.group1## [1] 3nr.replicates.group2 = sum(conditions == unique(conditions)[2])
nr.replicates.group2## [1] 3Running DESeq
This might take quite a long time!
method = "per-condition"      # method = c( "pooled", "per-condition", "blind" )
sharingMode = "maximum"       # sharingMode = c( "maximum", "fit-only", "gene-est-only" )
fitType = "parametric"        # fitType = c("parametric", "local")
cds <- DESeq::newCountDataSet(countData = counts, conditions = conditions)
cds <- DESeq::estimateSizeFactors(cds)
cds <- DESeq::estimateDispersions(cds, method = method, sharingMode = sharingMode, fitType = fitType)
cond1 = unique(conditions)[1]
cond1
## [1] "10mM"cond2 = unique(conditions)[2]
cond2## [1] "0mM"res <- DESeq::nbinomTest(cds, cond1, cond2)
options(width = 110)
class(res)## [1] "data.frame"head(res)## id baseMean baseMeanA baseMeanB foldChange log2FoldChange pval padj
## 1 ENSG00000101557 3020.629949 3118.736628 2922.523269 0.9370856 -0.09374721 3.915884e-02 1.094709e-01
## 2 ENSG00000079134 568.215137 570.746238 565.684036 0.9911306 -0.01285299 9.219691e-01 1.000000e+00
## 3 ENSG00000261724 9.625743 12.461472 6.790014 0.5448806 -0.87598802 1.377790e-01 3.135394e-01
## 4 ENSG00000158270 12543.776728 16246.055825 8841.497632 0.5442243 -0.87772684 3.512526e-137 2.870532e-135
## 5 ENSG00000079101 25.200071 34.912756 15.487385 0.4436025 -1.17266062 7.678901e-04 3.155856e-03
## 6 ENSG00000176912 9.869019 6.735315 13.002723 1.9305292 0.94899639 1.051728e-01 2.528601e-01MA - plot
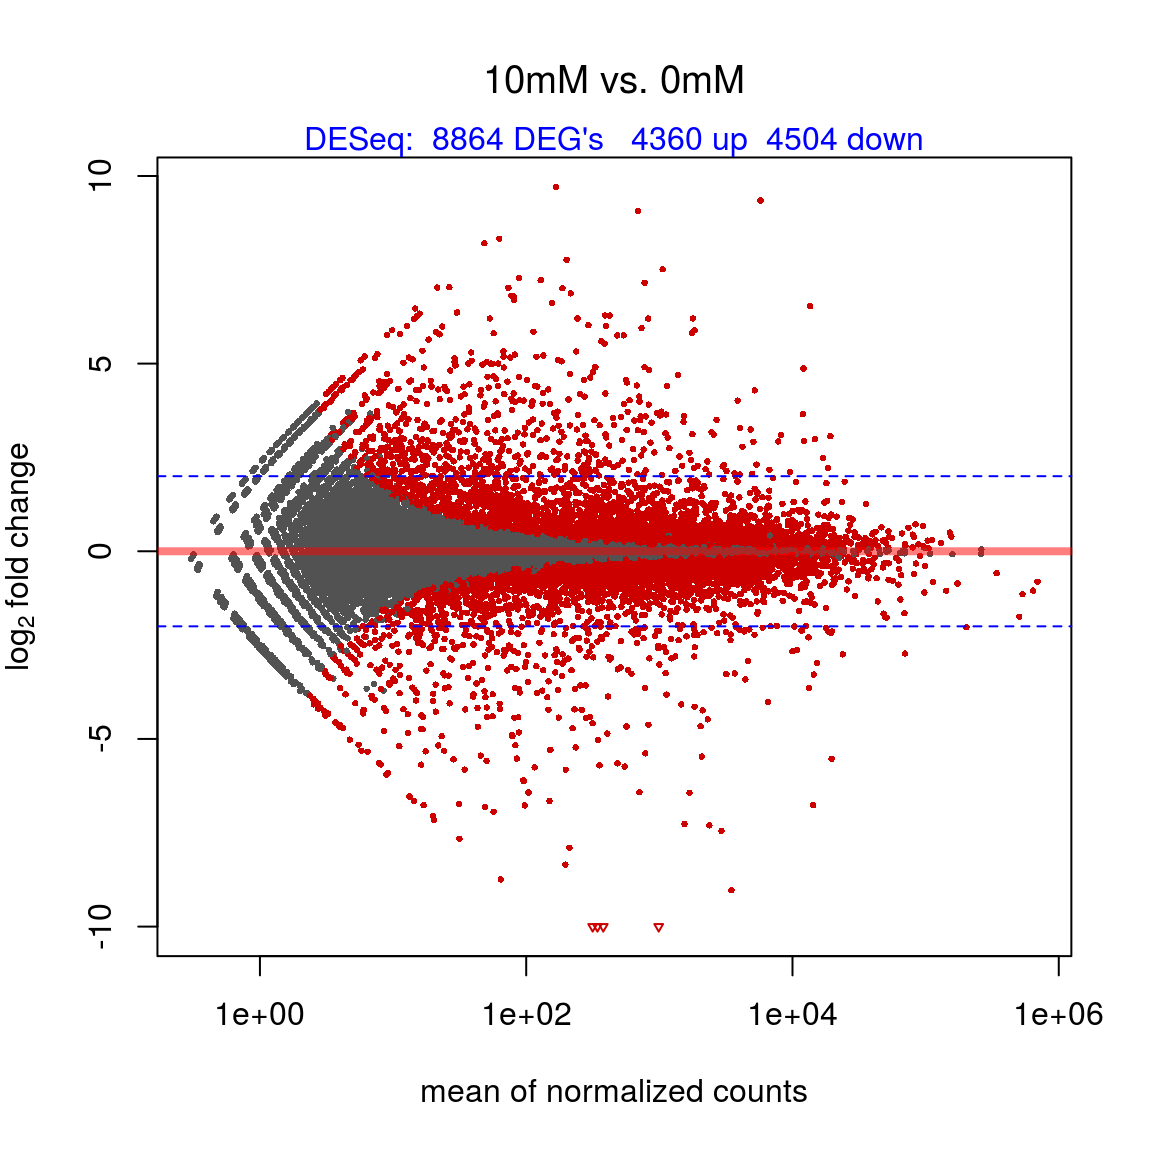
- MA-plot: logarithmic fold changes (on the y-axis) versus the mean of normalized counts (on the x-axis)
- Wikipedia
nr.deg = sum(res$padj <= 0.05)
nr.up = sum((res$padj <= 0.05) & (res$log2FoldChange > 0))
nr.down = sum((res$padj <= 0.05) & (res$log2FoldChange < 0))
x <- res[,c("baseMean", "log2FoldChange", "padj")]  # required by plotMA
head(x)
## baseMean log2FoldChange padj
## 1 3020.629949 -0.09374721 1.094709e-01
## 2 568.215137 -0.01285299 1.000000e+00
## 3 9.625743 -0.87598802 3.135394e-01
## 4 12543.776728 -0.87772684 2.870532e-135
## 5 25.200071 -1.17266062 3.155856e-03
## 6 9.869019 0.94899639 2.528601e-01y.limits = c(max(min(x$log2FoldChange), -10), min(max(x$log2FoldChange), 10)) # limit to (-10, 10) or smaller
y.limits ## [1] -10.000000 9.705805maintxt = paste(cond1, "vs.", cond2)
DESeq::plotMA(x, ylim = y.limits, col = ifelse(x$padj >= 0.05, "gray32", "red3"), main = maintxt, font.main = 1)
mtext(paste("DESeq: ", nr.deg, "DEG's ", nr.up, "up ", nr.down, "down"), side = 3, col = "blue")
abline(h = c(-2, 2), col = "blue", lty = 2, cex = 0.8) # horizontal blue lines show 4-fold changes.