Heatmaps
What does a heatmap show?
- uses a color code to visualize the magnitudes of the elements of a matrix
- row and columns can be rearranged according to some clustering algorithm
A very simple heatmap
x = matrix(1:25, byrow = T, ncol = 5)
colnames(x) = LETTERS[1:5]
rownames(x) = 1:5
x
## A B C D E
## 1 1 2 3 4 5
## 2 6 7 8 9 10
## 3 11 12 13 14 15
## 4 16 17 18 19 20
## 5 21 22 23 24 25heatmap(x, Rowv = NA , Colv = NA, scale = "none") # without reordering of rows and columns, without scaling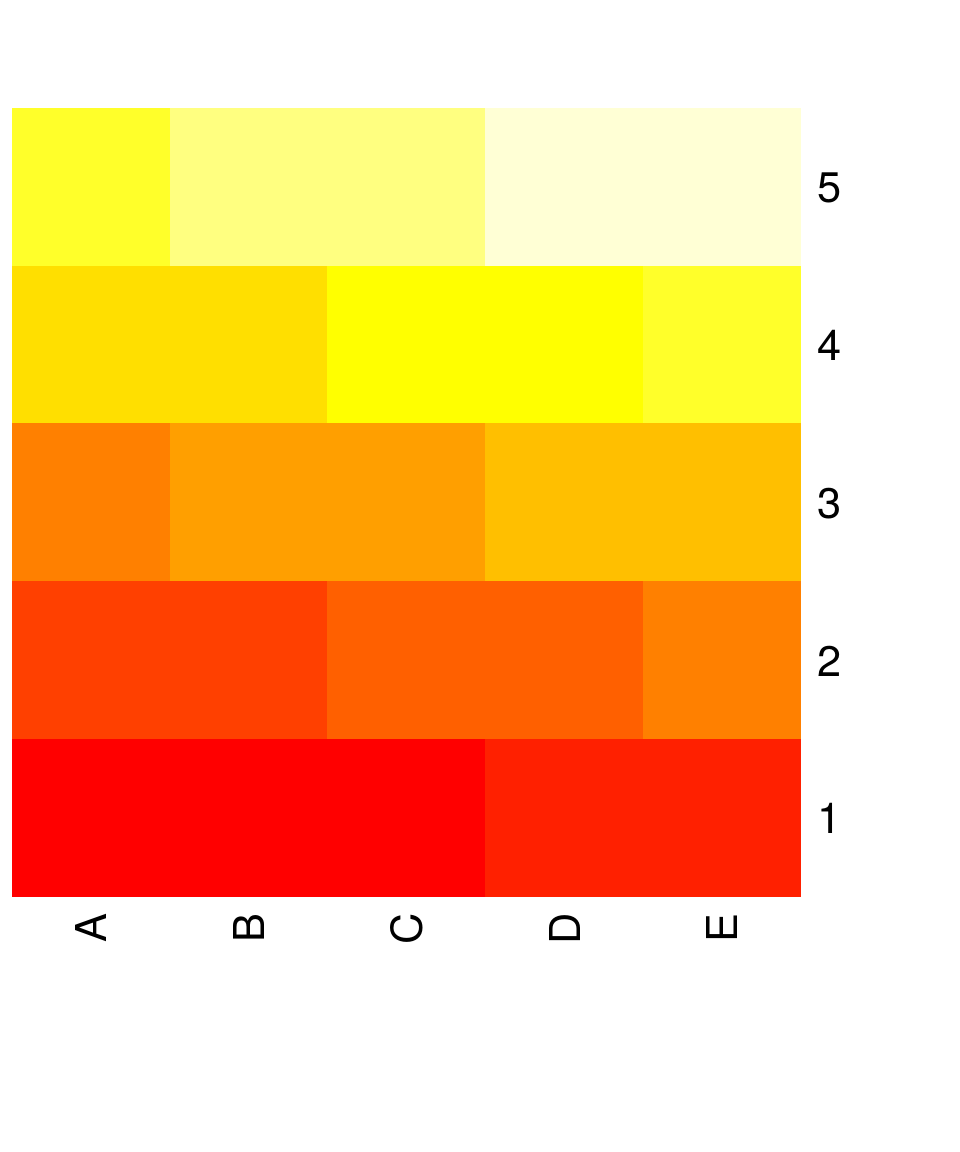
Note: Scaling (parameter scale) centers and scales values in either the row or column direction!
Unfortunately, heatmap turns the matrix around
The simplest heatmap is just the same as image(t(x))
Heatmap with clustering
heatmap(x, scale = "none") # without scaling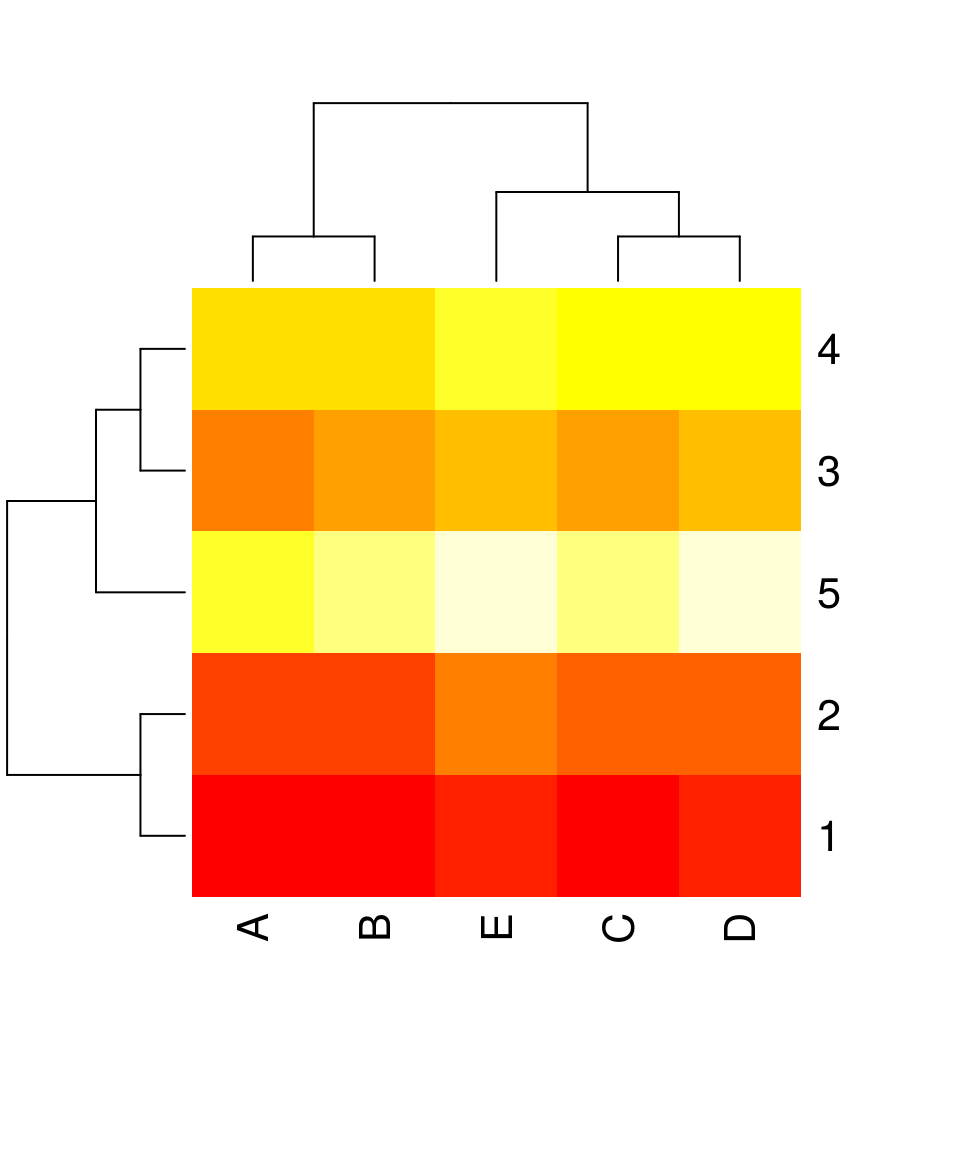
Reordering requires specification of:
- the algorithm used for clustering (default:
hclust- hierarchical clustering) - the distance measure used by clustering (default:
euclidean)
Changing the appearance
heatmap(x, scale = "none", col = rainbow(25), main = "Rainbow colors", margins = c(5,5)) 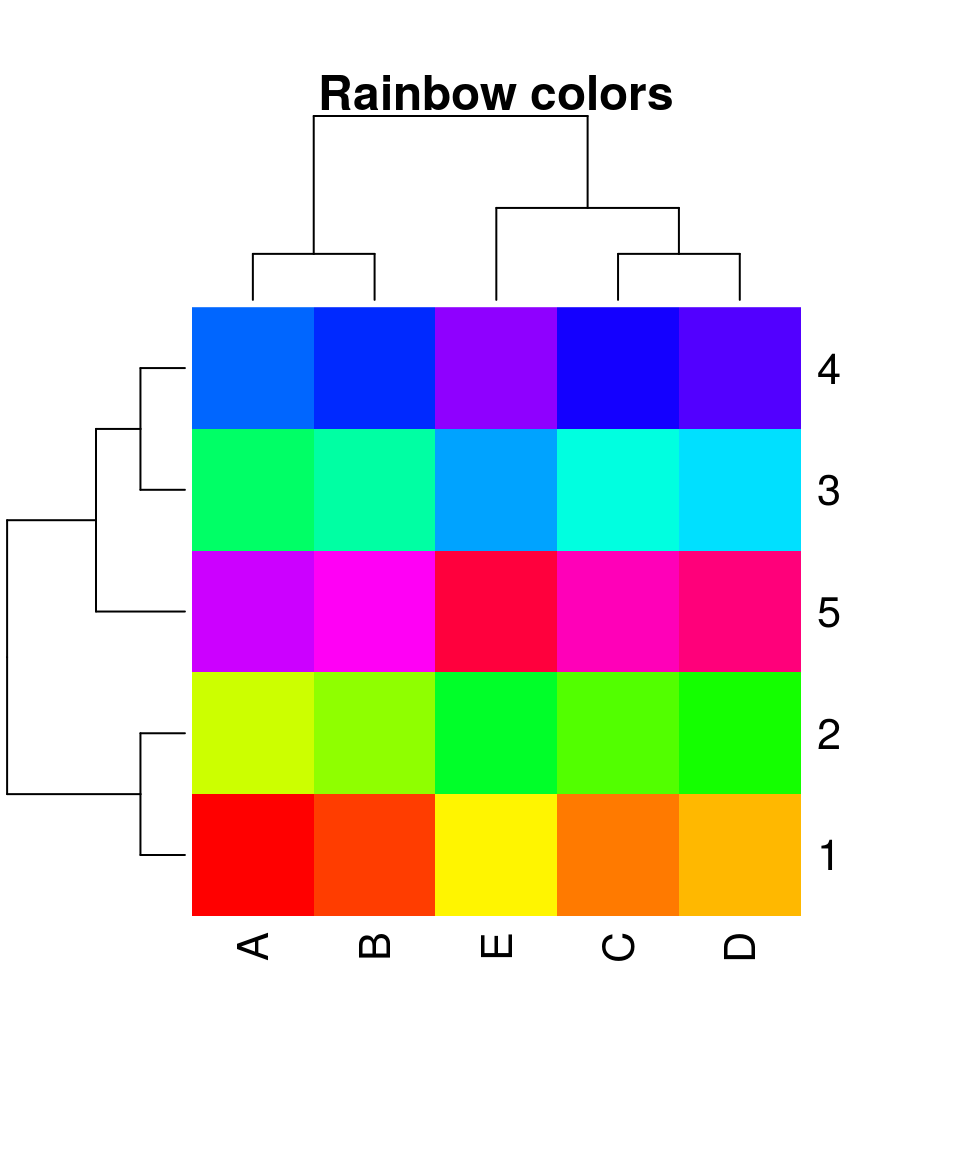
Using heatmap.2
library(gplots)##
## Attaching package: 'gplots'## The following object is masked from 'package:IRanges':
##
## space## The following object is masked from 'package:S4Vectors':
##
## space## The following object is masked from 'package:stats':
##
## lowessheatmap.2(x, trace = "none", density.info = "none", dendrogram = "row", Colv = "NA", main = "Heatmap", col = topo.colors(20))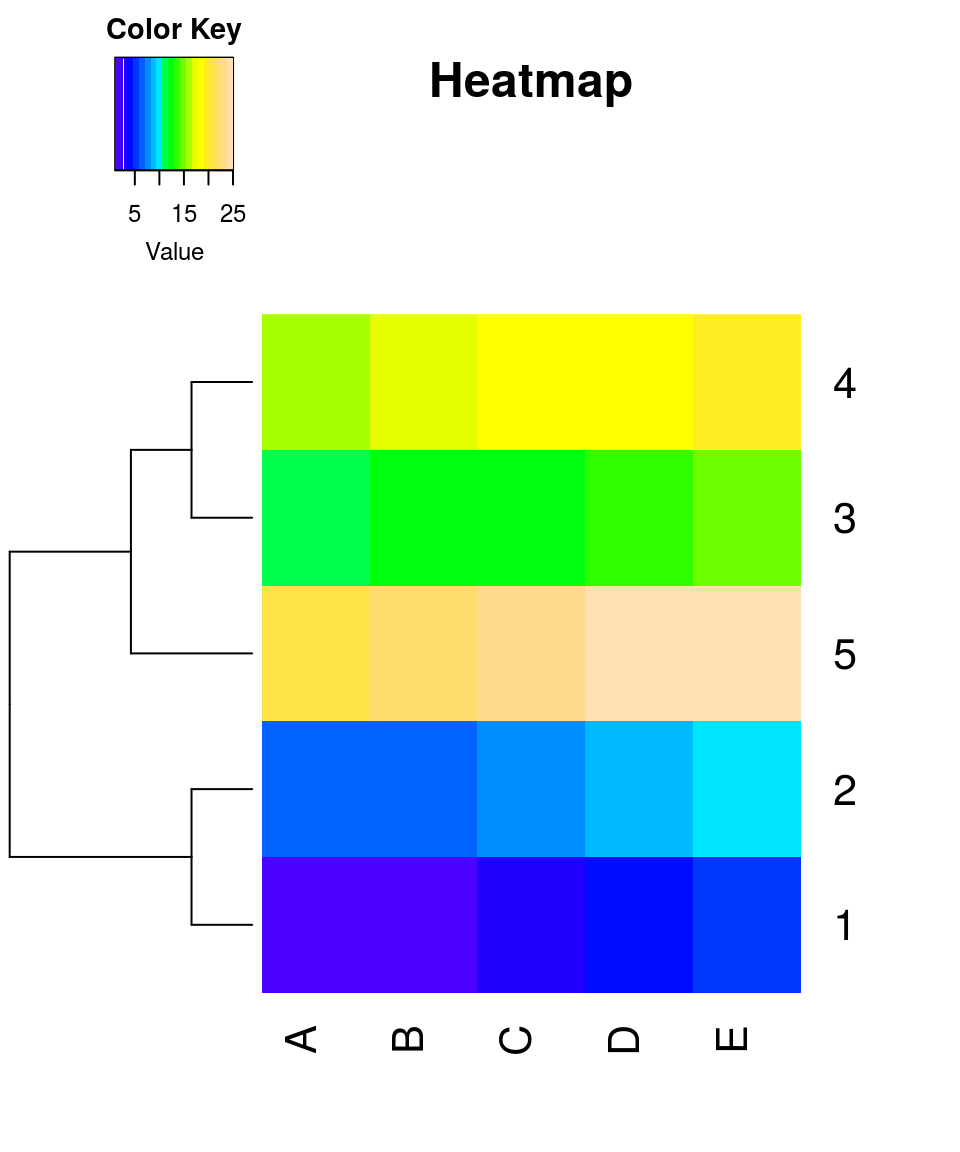
Parameter settings:
- Dendrogram is created for the rows only
- density.info = “none” turns off density plot inside color legend
- trace=“none” turns off trace lines inside the heat map
- Colv=“NA” turns off column clustering
- color palettes
Using another distance
mat = matrix(rnorm(25), ncol = 5)
colnames(mat) = LETTERS[1:5]
rownames(mat) = letters[1:5]
heatmap.2(mat, trace = "none",  density.info = "none", dendrogram = "col", hclust = function(x) hclust(x, method = "complete"), distfun = function(x) as.dist(1-cor(x, method = "pearson")))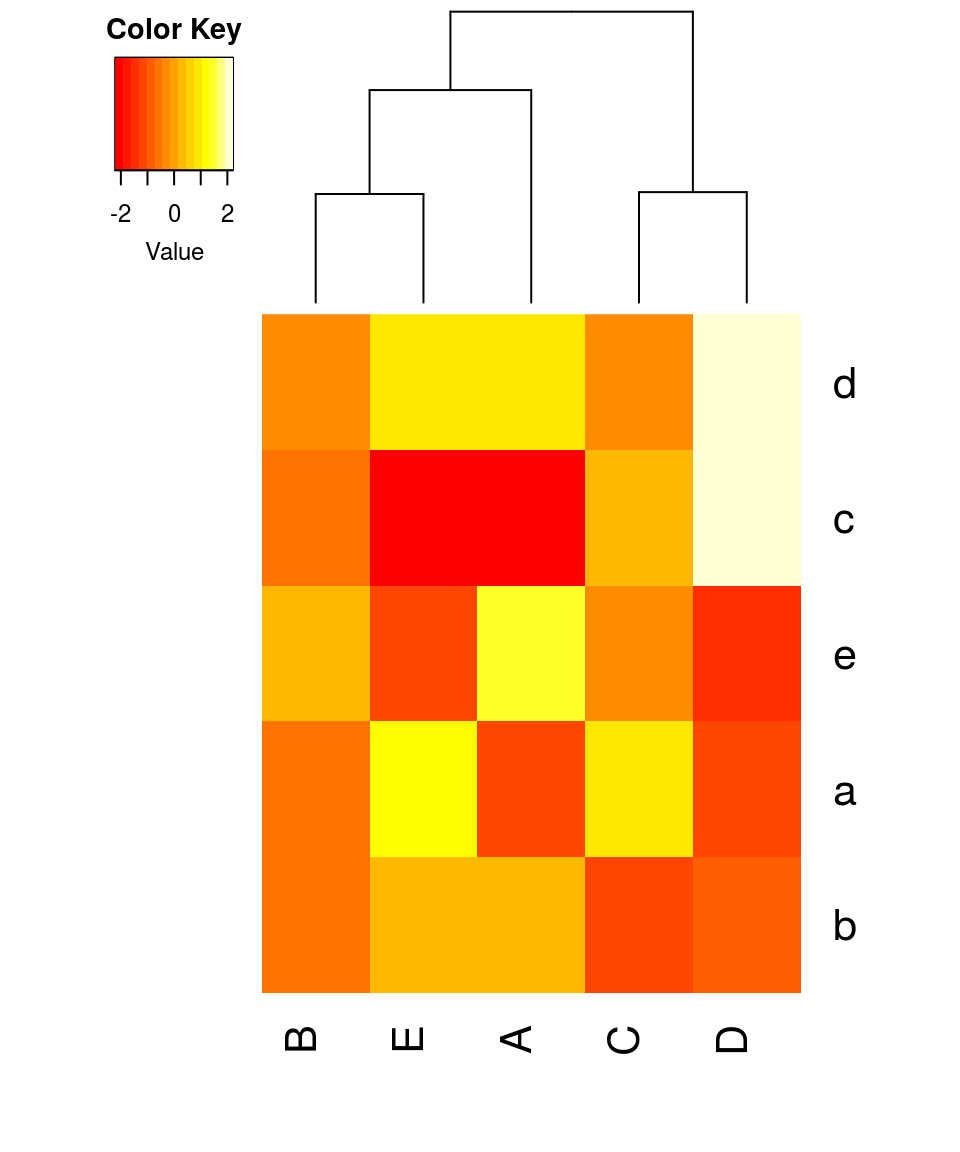
Parameter settings:
- 1 - correlation is used as a distance measure
- hierarchical clustering is conducted using the ‘complete’ algorithm
Gene expression (RPKM)
rpkm = get(load("Gene_expression_RPKM.RData"))
class(rpkm)
## [1] "matrix"dim(rpkm)## [1] 8 50rpkm[,1:6] ## ZK816.5 H04M03.48 Y57G11C.47 F44G4.1 T01G5.3 Y74C10AL.2
## 1d_DMSO 1.1005445 1.1162979 0.2006855 3.0373776 2.06624935 2.2633612
## 5d_DMSO 0.2608296 3.5519068 0.4722332 0.3682567 0.03881845 0.7676177
## 10d_DMSO 0.3944343 0.8953242 4.9258110 4.6982990 3.19578046 0.9466139
## 20d_DMSO 6.6255019 1.1693687 2.1356216 2.2803941 1.33951785 1.1976254
## 1d_DOG 7.6564441 5.6090525 3.2428403 7.6189638 4.60724855 4.7608273
## 5d_DOG 6.5659749 4.3029734 3.3611766 7.9542215 8.89153267 1.1944005
## 10d_DOG 4.6098874 6.7378059 5.8631724 9.4470706 1.00390257 4.5446366
## 20d_DOG 7.5589978 4.2755153 5.5044935 5.0802457 5.53324173 0.1645560heatmap.2(rpkm, trace = "none", density.info = "none", dendrogram = "row", Colv = "NA", main = "RPKM", col = rainbow(10), margins = c(8, 10))