Visualization
Histograms
- show empirical distribution of data
- data is grouped into bins
x = rnorm(500, mean = 2, sd = 0.8)  # sample from normal distribution
hist(x)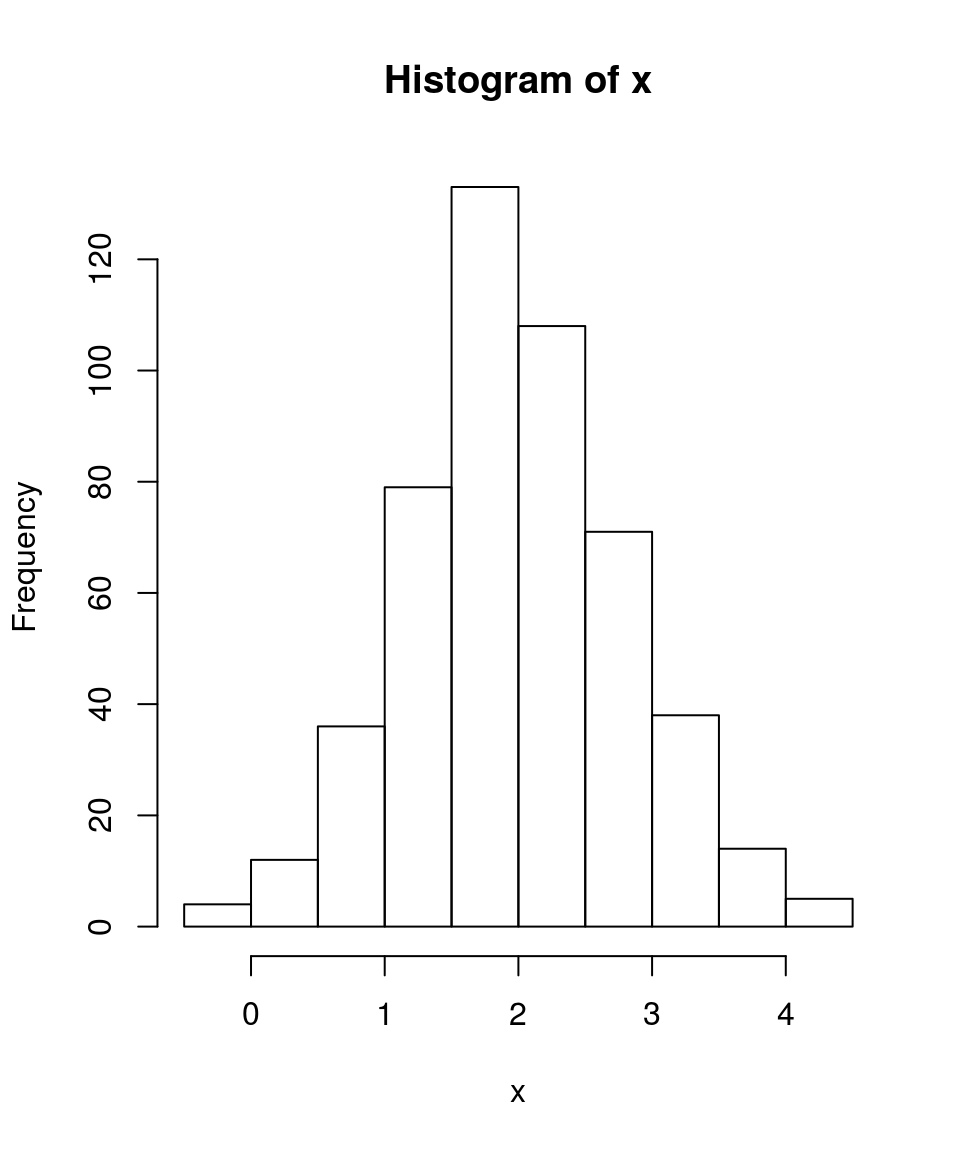
hist(x, col = "red", breaks = 25, main = "Sample from N(2, 0.8)", font.main = 1)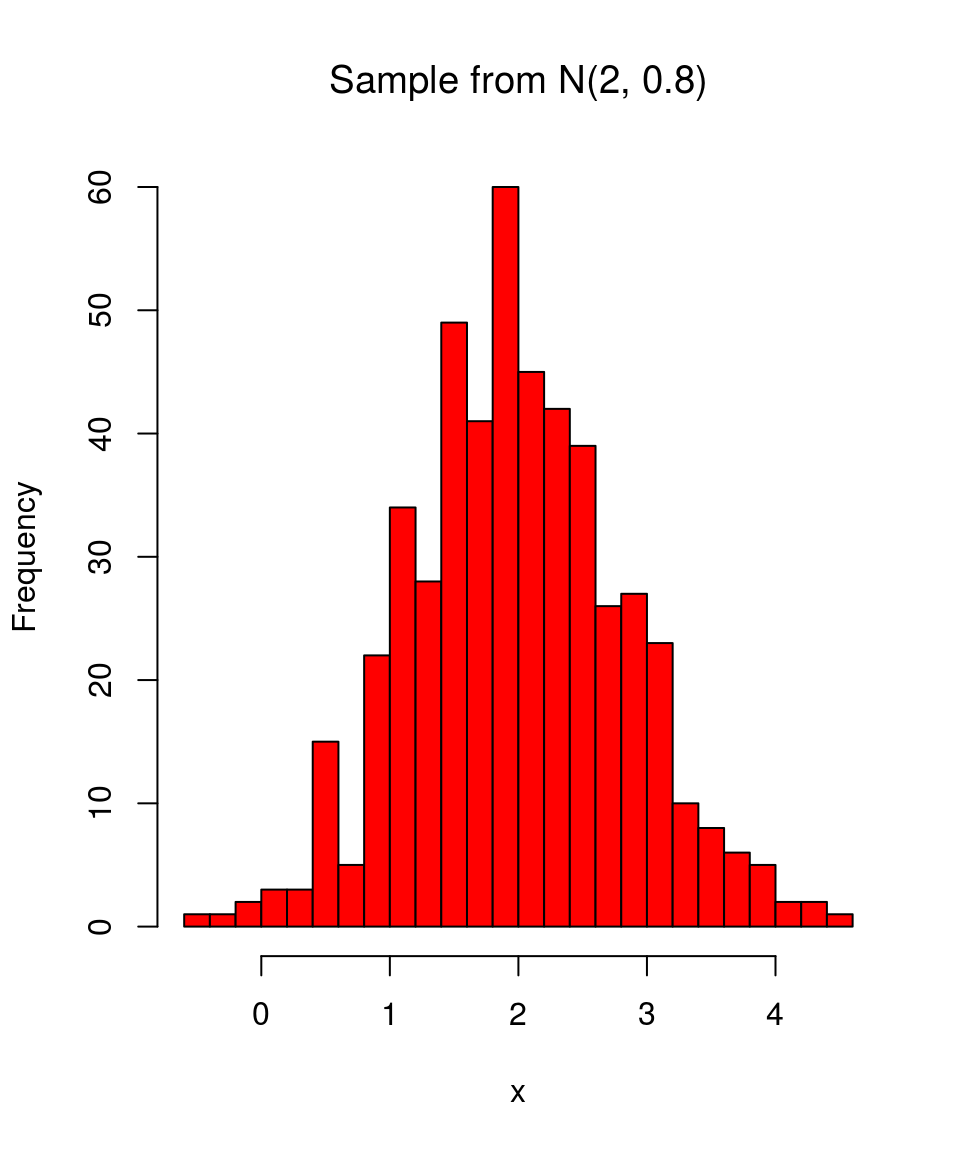
x = rnorm(500, mean = 2, sd = 0.8) # sample from normal distribution
hist(x)
hist(x, col = "red", breaks = 25, main = "Sample from N(2, 0.8)", font.main = 1)