Plotting matrices using matplot()
- ‘matplot’ plots the columns of one matrix against the columns of another.
x = seq(0, 10, len = 41)
mat = matrix(c(1.2*x, 1.5*x, 1.8*x), ncol = 3, byrow = FALSE)
head(mat)
##      [,1]  [,2] [,3]
## [1,]  0.0 0.000 0.00
## [2,]  0.3 0.375 0.45
## [3,]  0.6 0.750 0.90
## [4,]  0.9 1.125 1.35
## [5,]  1.2 1.500 1.80
## [6,]  1.5 1.875 2.25
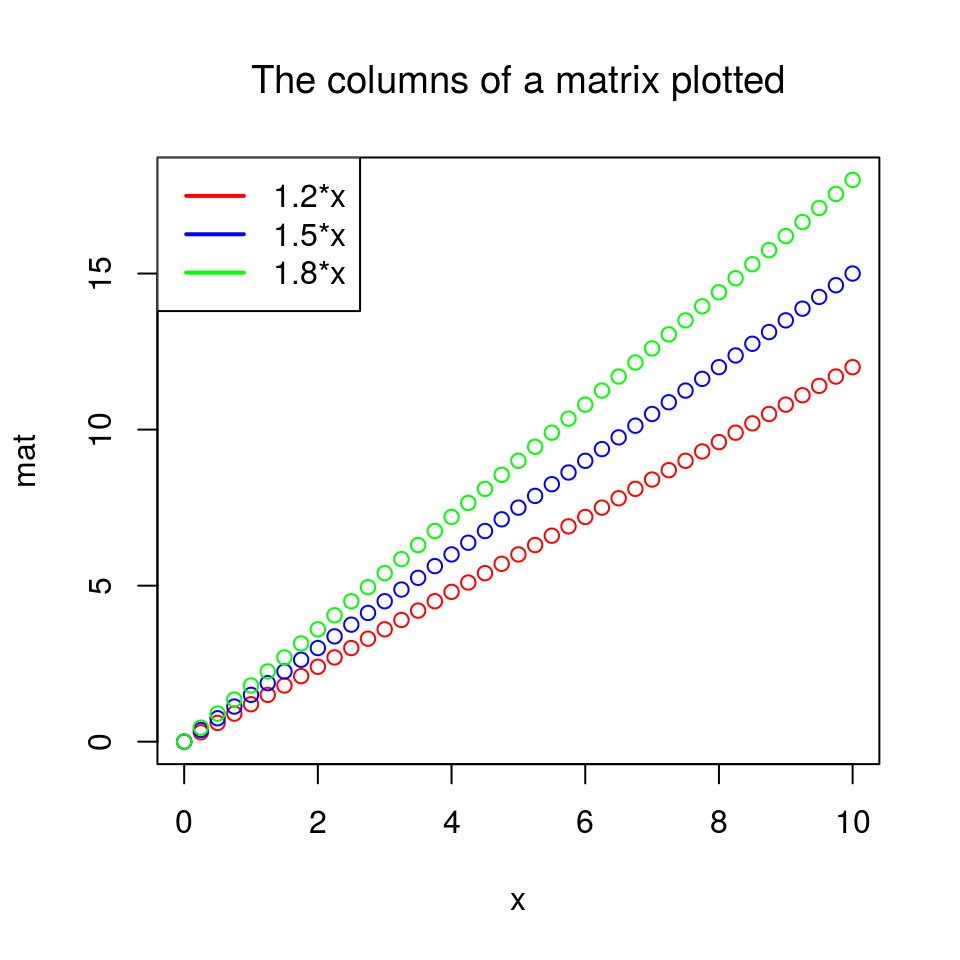
matplot(x, mat, pch = 1, type = "p", col = c("red", "blue", "green"))
legend("topleft", legend = c("1.2*x", "1.5*x", "1.8*x"), lty = 1, lwd = 2, col = c("red", "blue", "green"))
title("The columns of a matrix plotted", font.main = 1)