Test for equality of proportions
What does this test do?
- decides if two (or more) proportions differ significantly
- quite similar task as for
fisher.test()but allows for larger numbers due to some approximations made - \(H_0\) : \(p_1 = p_2 = \dots = p_k\) (equal proportions, independence)
- a small p-value means that the null is rejected, i.e. that the proportions differ significantly
- function:
prop.test()
Running the test
smokers  <- c( 83, 90, 129, 70 )
patients <- c( 86, 93, 136, 82 )
percent_smokers = round(smokers/patients*100, 1)
percent_smokers
## [1] 96.5 96.8 94.9 85.4barplot(percent_smokers, col = "red")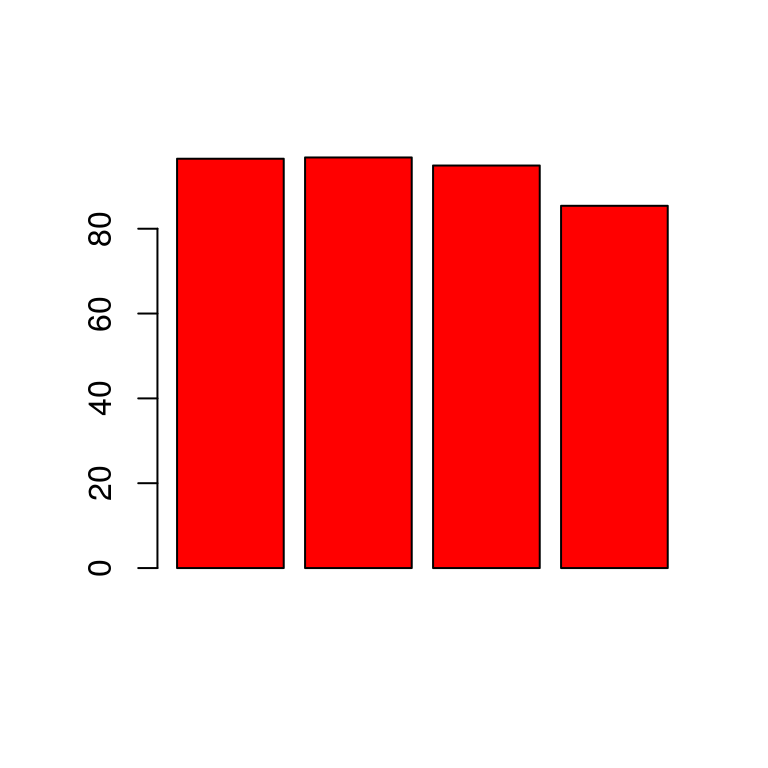
\(H_0\): the 4 populations from which the patients were drawn have the same true proportion of smokers
\(H_a\): this proportion is different in at least one of the populations
prop.test(smokers, patients) ##
## 4-sample test for equality of proportions without continuity
## correction
##
## data: smokers out of patients
## X-squared = 12.6, df = 3, p-value = 0.005585
## alternative hypothesis: two.sided
## sample estimates:
## prop 1 prop 2 prop 3 prop 4
## 0.9651163 0.9677419 0.9485294 0.8536585Reading the output
The null hypothesis is rejected, even if one would not expect this looking at the barplot. Significance is achieved because of the large sample sizes. This is a general issue when it comes to hypothesis tests. It it questionable if the differences in the proportions have any practical meaning.