Cluster analysis
What does cluster analysis do?
- group data according to their mutual distance
Clustering using kmeans
Get some data:
clouds = get(load("clouds.RData"))
dim(clouds)
## [1] 75 2head(clouds)## cloud1_x cloud1_y
## [1,] 1.454594 3.751767
## [2,] 1.072375 4.571505
## [3,] 1.028263 3.808842
## [4,] 1.508426 3.705582
## [5,] 0.889498 4.217310
## [6,] 1.291009 4.051441plot(clouds[,1], clouds[,2], col = "black", xlab = "x", ylab = "y", main = "Clouds", font.main = 1)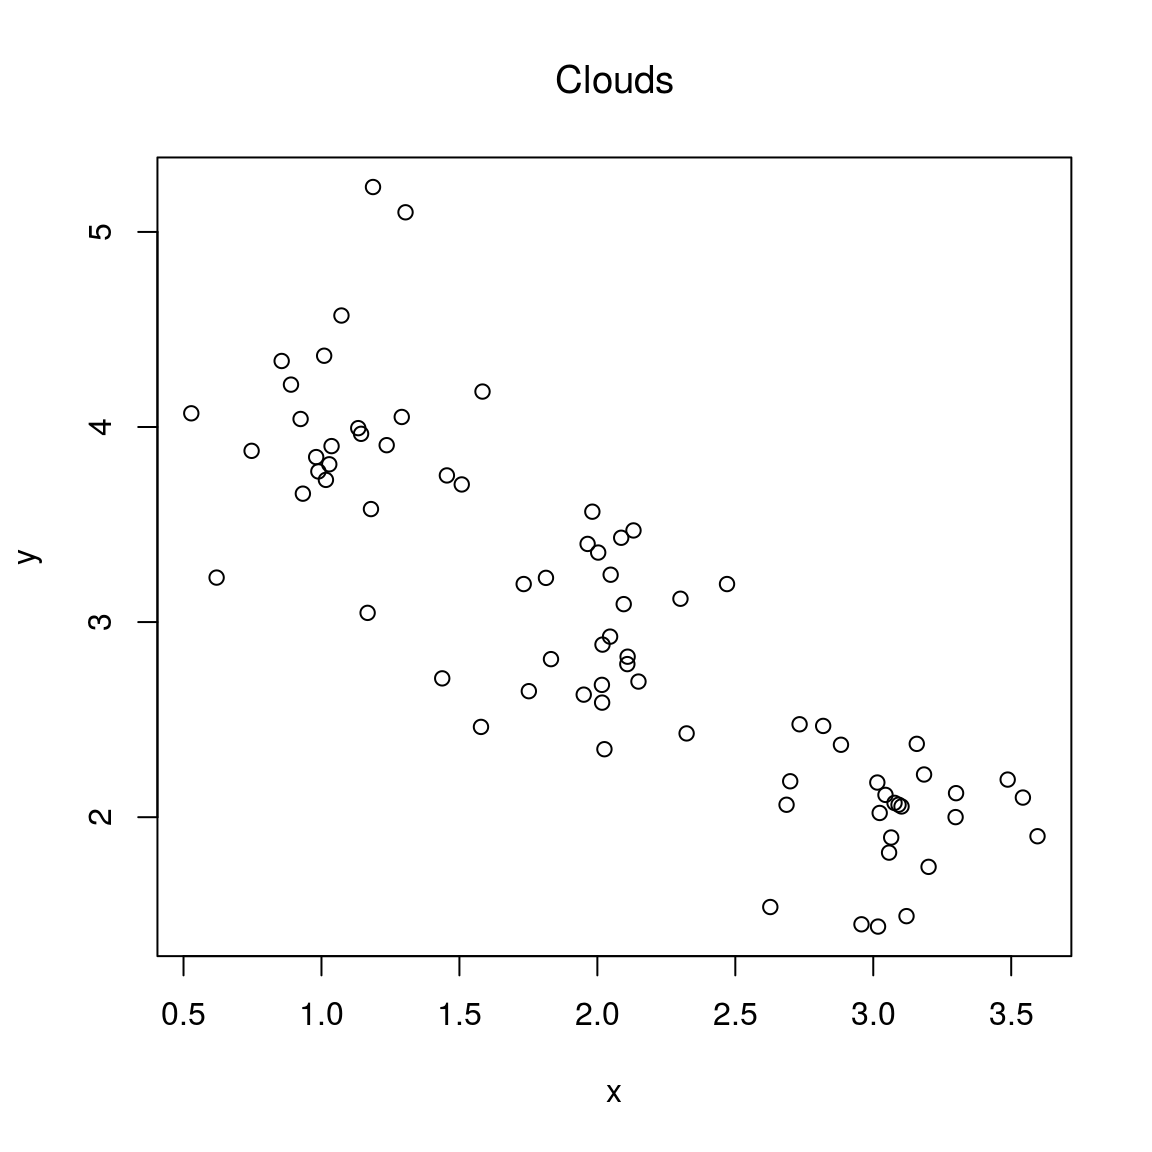
Cluster with kmeans:
nr = 3                      # needs number of clusters as input
clres = kmeans(clouds, nr)
str(clres)
## List of 9
## $ cluster : int [1:75] 3 3 3 3 3 3 3 3 3 3 ...
## $ centers : num [1:3, 1:2] 1.97 3.07 1.07 2.95 2.01 ...
## ..- attr(*, "dimnames")=List of 2
## .. ..$ : chr [1:3] "1" "2" "3"
## .. ..$ : chr [1:2] "cloud1_x" "cloud1_y"
## $ totss : num 114
## $ withinss : num [1:3] 4.92 3.66 6.13
## $ tot.withinss: num 14.7
## $ betweenss : num 99.5
## $ size : int [1:3] 26 25 24
## $ iter : int 2
## $ ifault : int 0
## - attr(*, "class")= chr "kmeans"clres$cluster## [1] 3 3 3 3 3 3 3 3 3 3 3 3 3 3 3 3 3 1 3 3 3 3 3 3 3 2 2 2 2 2 2 2 2 2 2
## [36] 2 2 2 2 2 2 2 2 2 2 2 2 2 2 2 1 1 1 1 1 1 1 1 1 1 1 1 1 1 1 1 1 1 1 1
## [71] 1 1 1 1 1Plot, color according to identified clusters:
colvec = rep("black", nrow(clouds))
clres$cluster == 1
## [1] FALSE FALSE FALSE FALSE FALSE FALSE FALSE FALSE FALSE FALSE FALSE
## [12] FALSE FALSE FALSE FALSE FALSE FALSE TRUE FALSE FALSE FALSE FALSE
## [23] FALSE FALSE FALSE FALSE FALSE FALSE FALSE FALSE FALSE FALSE FALSE
## [34] FALSE FALSE FALSE FALSE FALSE FALSE FALSE FALSE FALSE FALSE FALSE
## [45] FALSE FALSE FALSE FALSE FALSE FALSE TRUE TRUE TRUE TRUE TRUE
## [56] TRUE TRUE TRUE TRUE TRUE TRUE TRUE TRUE TRUE TRUE TRUE
## [67] TRUE TRUE TRUE TRUE TRUE TRUE TRUE TRUE TRUEwhich(clres$cluster == 1)## [1] 18 51 52 53 54 55 56 57 58 59 60 61 62 63 64 65 66 67 68 69 70 71 72
## [24] 73 74 75colvec[which(clres$cluster == 1)] = "blue"
colvec[which(clres$cluster == 2)] = "red"
colvec[which(clres$cluster == 3)] = "green"
colvec## [1] "green" "green" "green" "green" "green" "green" "green" "green"
## [9] "green" "green" "green" "green" "green" "green" "green" "green"
## [17] "green" "blue" "green" "green" "green" "green" "green" "green"
## [25] "green" "red" "red" "red" "red" "red" "red" "red"
## [33] "red" "red" "red" "red" "red" "red" "red" "red"
## [41] "red" "red" "red" "red" "red" "red" "red" "red"
## [49] "red" "red" "blue" "blue" "blue" "blue" "blue" "blue"
## [57] "blue" "blue" "blue" "blue" "blue" "blue" "blue" "blue"
## [65] "blue" "blue" "blue" "blue" "blue" "blue" "blue" "blue"
## [73] "blue" "blue" "blue"plot(clouds[,1], clouds[,2], col = colvec, xlab = "x", ylab = "y", main = "Clusters found", font.main = 1)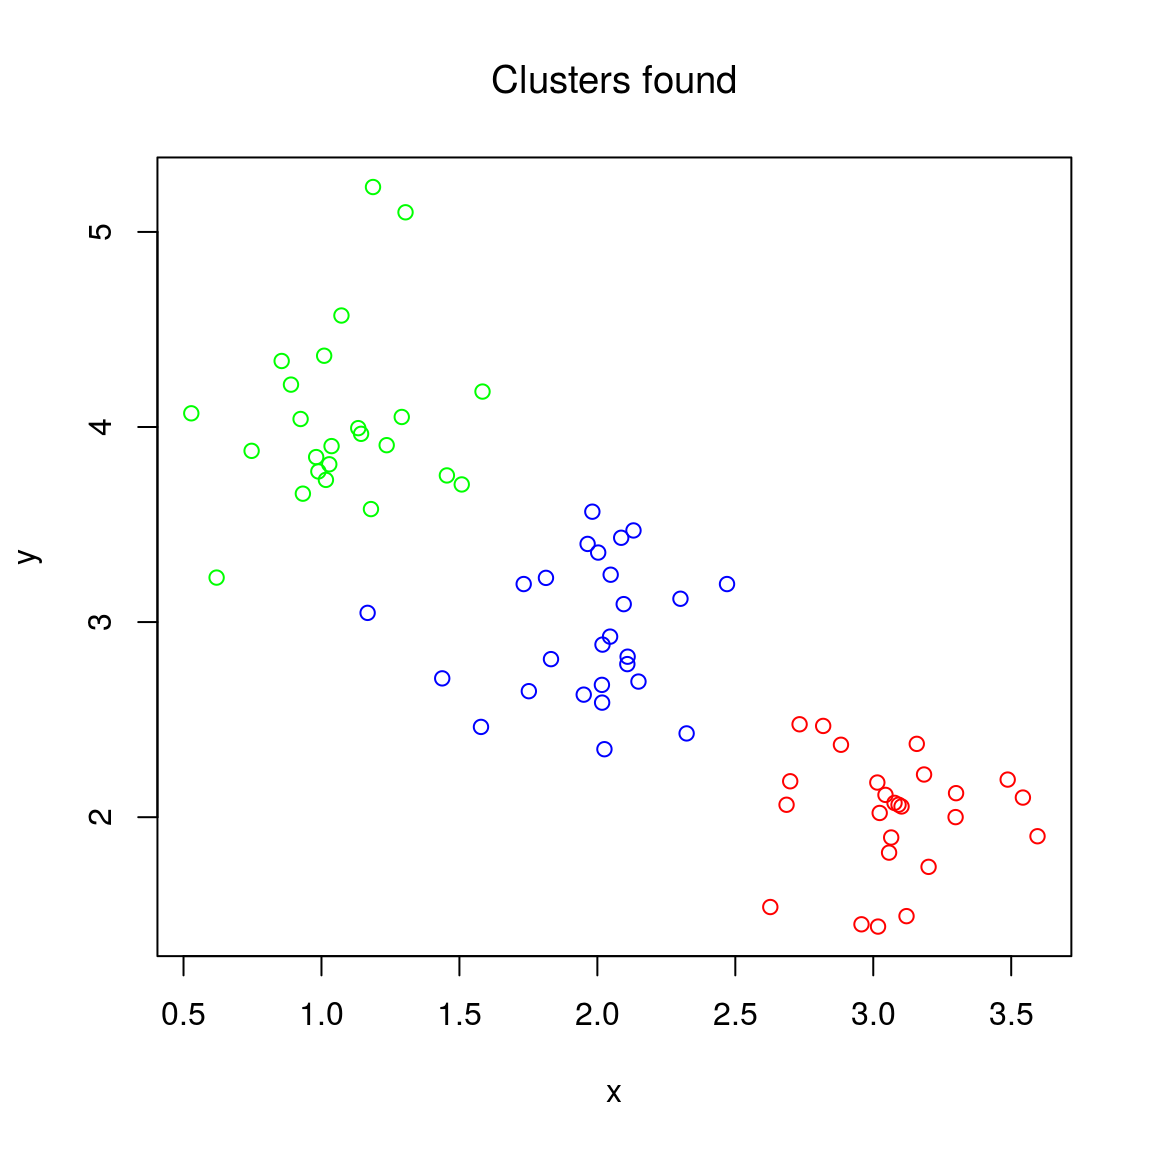
Add the cluster centers:
clres$centers## cloud1_x cloud1_y
## 1 1.967705 2.952207
## 2 3.071303 2.014523
## 3 1.068808 4.037214plot(clouds[,1], clouds[,2], col = colvec, xlab = "x", ylab = "y", main = "Clusters found", font.main = 1)
points(clres$centers[,1], clres$centers[,2], col = c("blue", "red", "green"), pch = 15, cex = 1.8)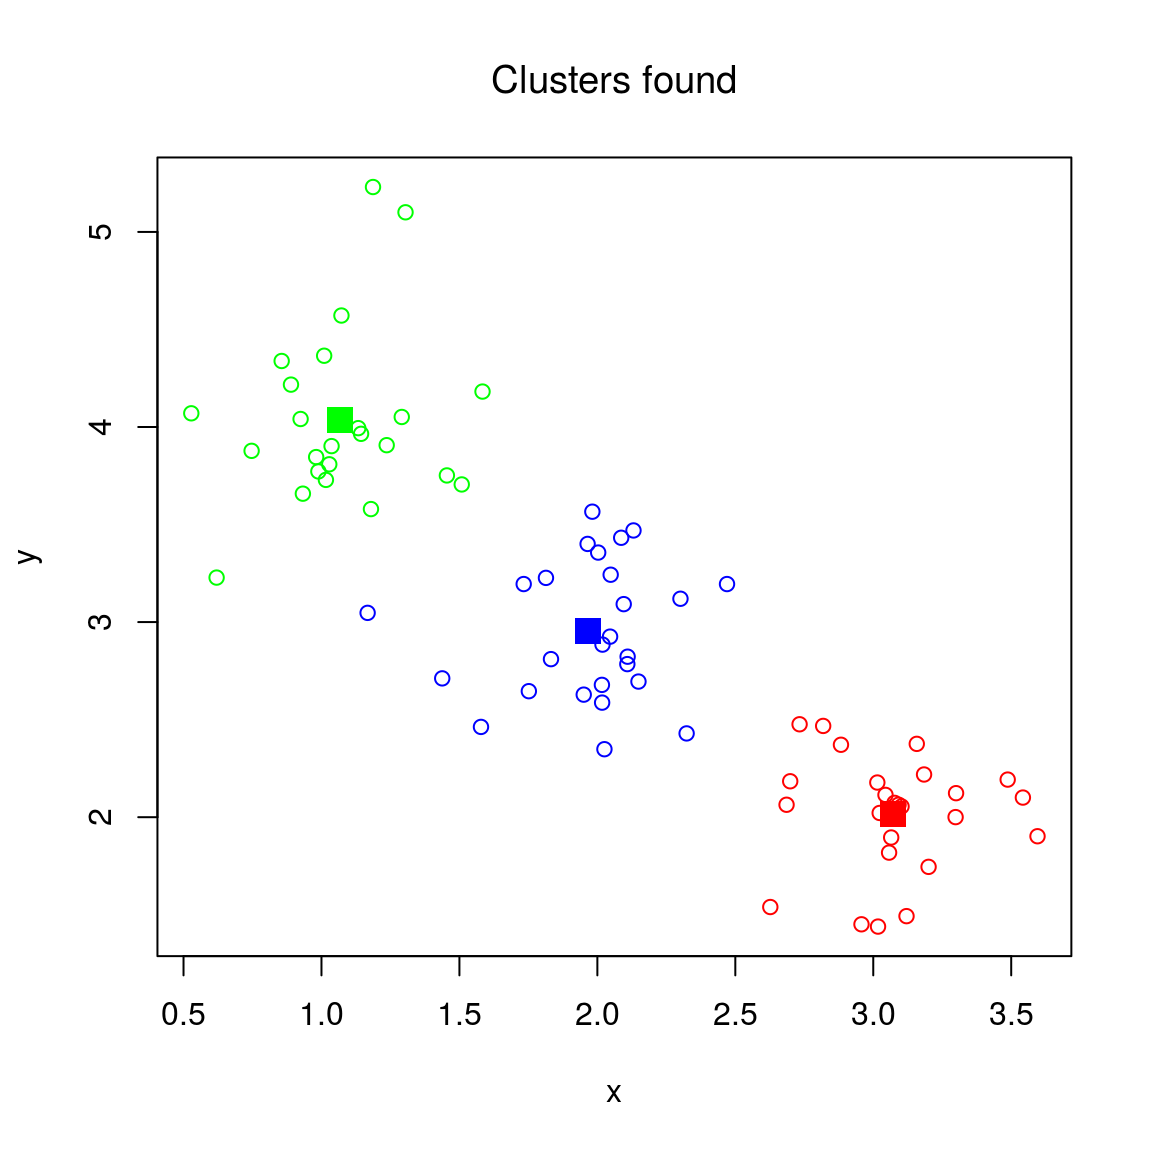
More dimensions (e.g. time lines):
Some data:
timedata = get(load("timedata.RData"))
matplot(1:10, t(timedata), pch = 1:6, type = "b", col = "black") 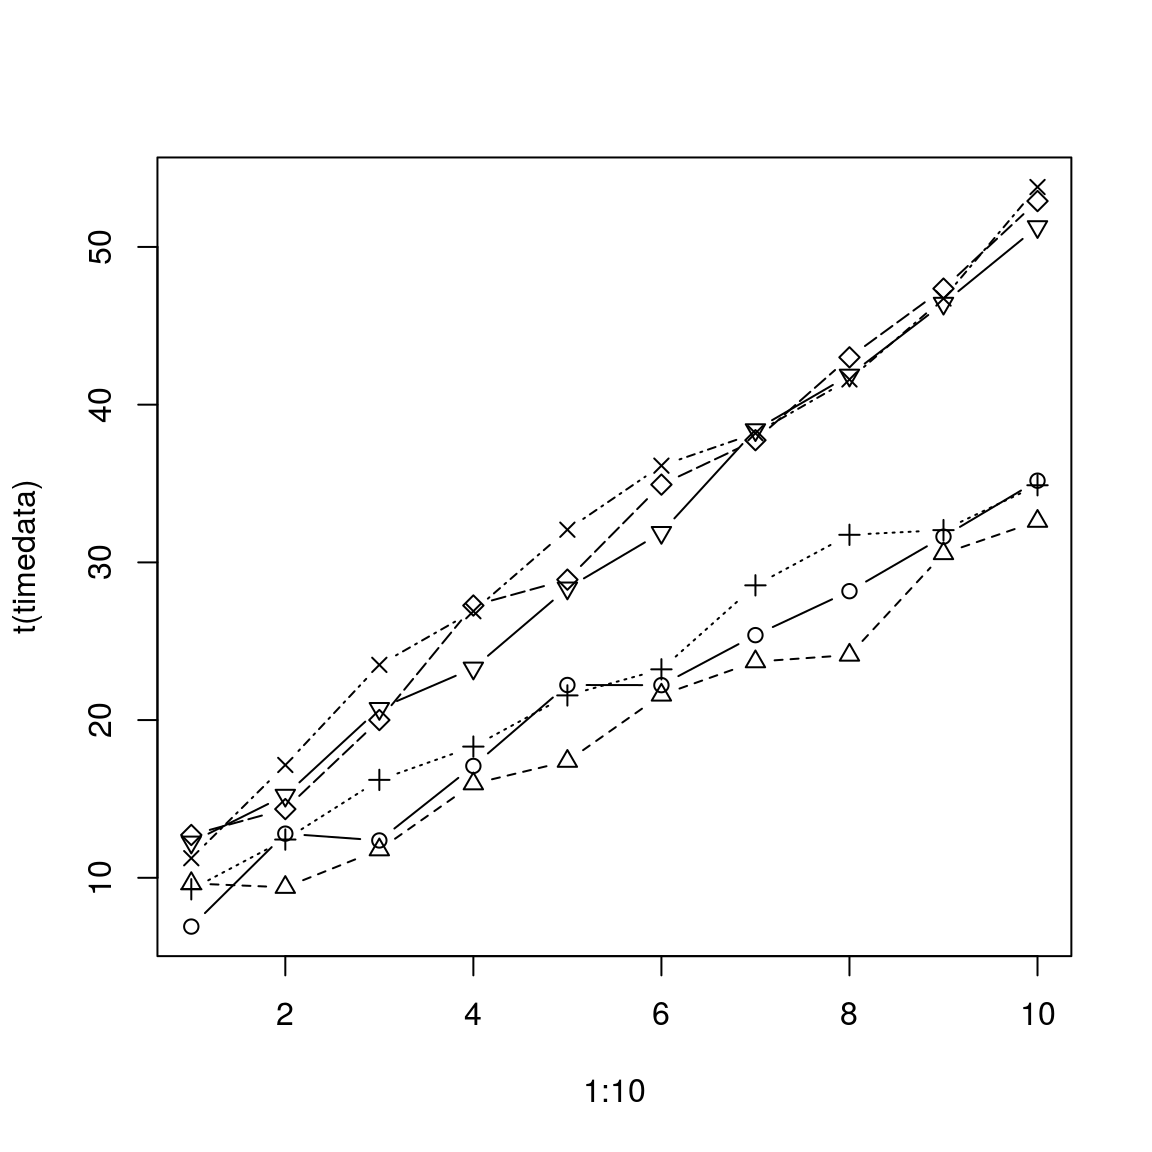
Find clusters (assume that there are two):
cres = kmeans(timedata, 2)
cres$cluster
## gene 1 gene 2 gene 3 gene 4 gene 5 gene 6
## 1 1 1 2 2 2colvec = rep("black", 6)
colvec[which(cres$cluster == 1)] = "blue"
colvec[which(cres$cluster == 2)] = "red"
cbind(cres$cluster, colvec)## colvec
## gene 1 "1" "blue"
## gene 2 "1" "blue"
## gene 3 "1" "blue"
## gene 4 "2" "red"
## gene 5 "2" "red"
## gene 6 "2" "red"matplot(1:10, t(timedata), pch = 1:6, type = "b", col = colvec, main = "Clustered timelines") 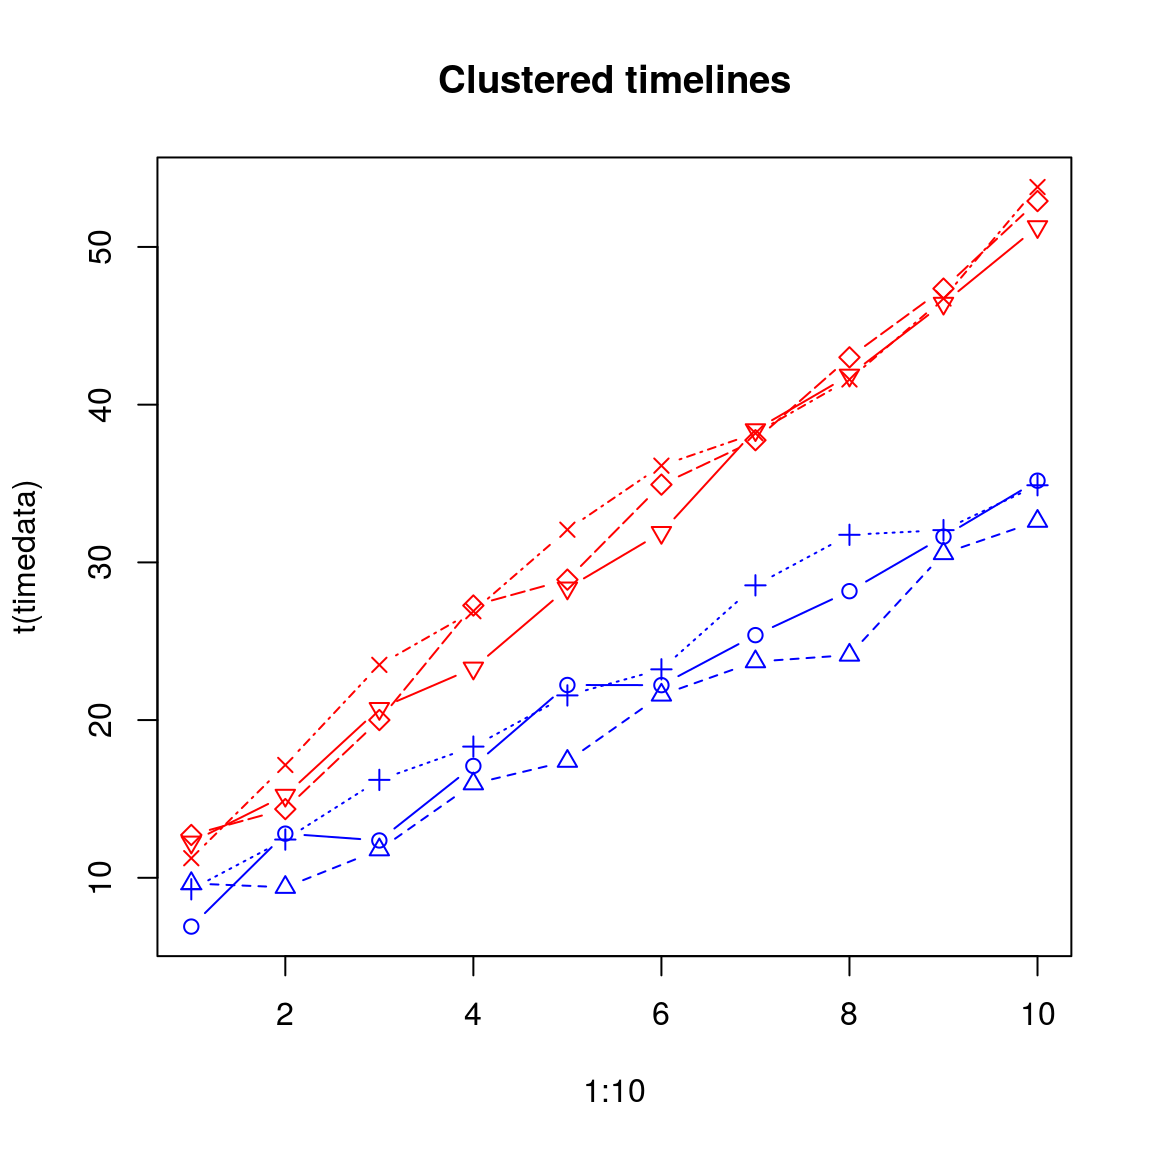
Clustering using cmeans
library(e1071)
nr = 3                      # needs number of clusters as input
res = cmeans(clouds, nr)
str(res)
## List of 7
## $ centers : num [1:3, 1:2] 1.98 3.08 1.07 2.96 2.02 ...
## ..- attr(*, "dimnames")=List of 2
## .. ..$ : chr [1:3] "1" "2" "3"
## .. ..$ : chr [1:2] "cloud1_x" "cloud1_y"
## $ size : int [1:3] 26 25 24
## $ cluster : int [1:75] 3 3 3 3 3 3 3 3 3 3 ...
## $ membership : num [1:75, 1:3] 0.1869 0.0819 0.0247 0.258 0.0258 ...
## ..- attr(*, "dimnames")=List of 2
## .. ..$ : NULL
## .. ..$ : chr [1:3] "1" "2" "3"
## $ iter : num 9
## $ withinerror: num 0.155
## $ call : language cmeans(x = clouds, centers = nr)
## - attr(*, "class")= chr "fclust"res$cluster## [1] 3 3 3 3 3 3 3 3 3 3 3 3 3 3 3 3 3 1 3 3 3 3 3 3 3 2 2 2 2 2 2 2 2 2 2
## [36] 2 2 2 2 2 2 2 2 2 2 2 2 2 2 2 1 1 1 1 1 1 1 1 1 1 1 1 1 1 1 1 1 1 1 1
## [71] 1 1 1 1 1Plot, color according to identified clusters:
colvec = rep("black", nrow(clouds))
res$cluster == 1
## [1] FALSE FALSE FALSE FALSE FALSE FALSE FALSE FALSE FALSE FALSE FALSE
## [12] FALSE FALSE FALSE FALSE FALSE FALSE TRUE FALSE FALSE FALSE FALSE
## [23] FALSE FALSE FALSE FALSE FALSE FALSE FALSE FALSE FALSE FALSE FALSE
## [34] FALSE FALSE FALSE FALSE FALSE FALSE FALSE FALSE FALSE FALSE FALSE
## [45] FALSE FALSE FALSE FALSE FALSE FALSE TRUE TRUE TRUE TRUE TRUE
## [56] TRUE TRUE TRUE TRUE TRUE TRUE TRUE TRUE TRUE TRUE TRUE
## [67] TRUE TRUE TRUE TRUE TRUE TRUE TRUE TRUE TRUEwhich(res$cluster == 1)## [1] 18 51 52 53 54 55 56 57 58 59 60 61 62 63 64 65 66 67 68 69 70 71 72
## [24] 73 74 75colvec[which(res$cluster == 1)] = "blue"
colvec[which(res$cluster == 2)] = "red"
colvec[which(res$cluster == 3)] = "green"
colvec## [1] "green" "green" "green" "green" "green" "green" "green" "green"
## [9] "green" "green" "green" "green" "green" "green" "green" "green"
## [17] "green" "blue" "green" "green" "green" "green" "green" "green"
## [25] "green" "red" "red" "red" "red" "red" "red" "red"
## [33] "red" "red" "red" "red" "red" "red" "red" "red"
## [41] "red" "red" "red" "red" "red" "red" "red" "red"
## [49] "red" "red" "blue" "blue" "blue" "blue" "blue" "blue"
## [57] "blue" "blue" "blue" "blue" "blue" "blue" "blue" "blue"
## [65] "blue" "blue" "blue" "blue" "blue" "blue" "blue" "blue"
## [73] "blue" "blue" "blue"plot(clouds[,1], clouds[,2], col = colvec, xlab = "x", ylab = "y", main = "Clusters found", font.main = 1)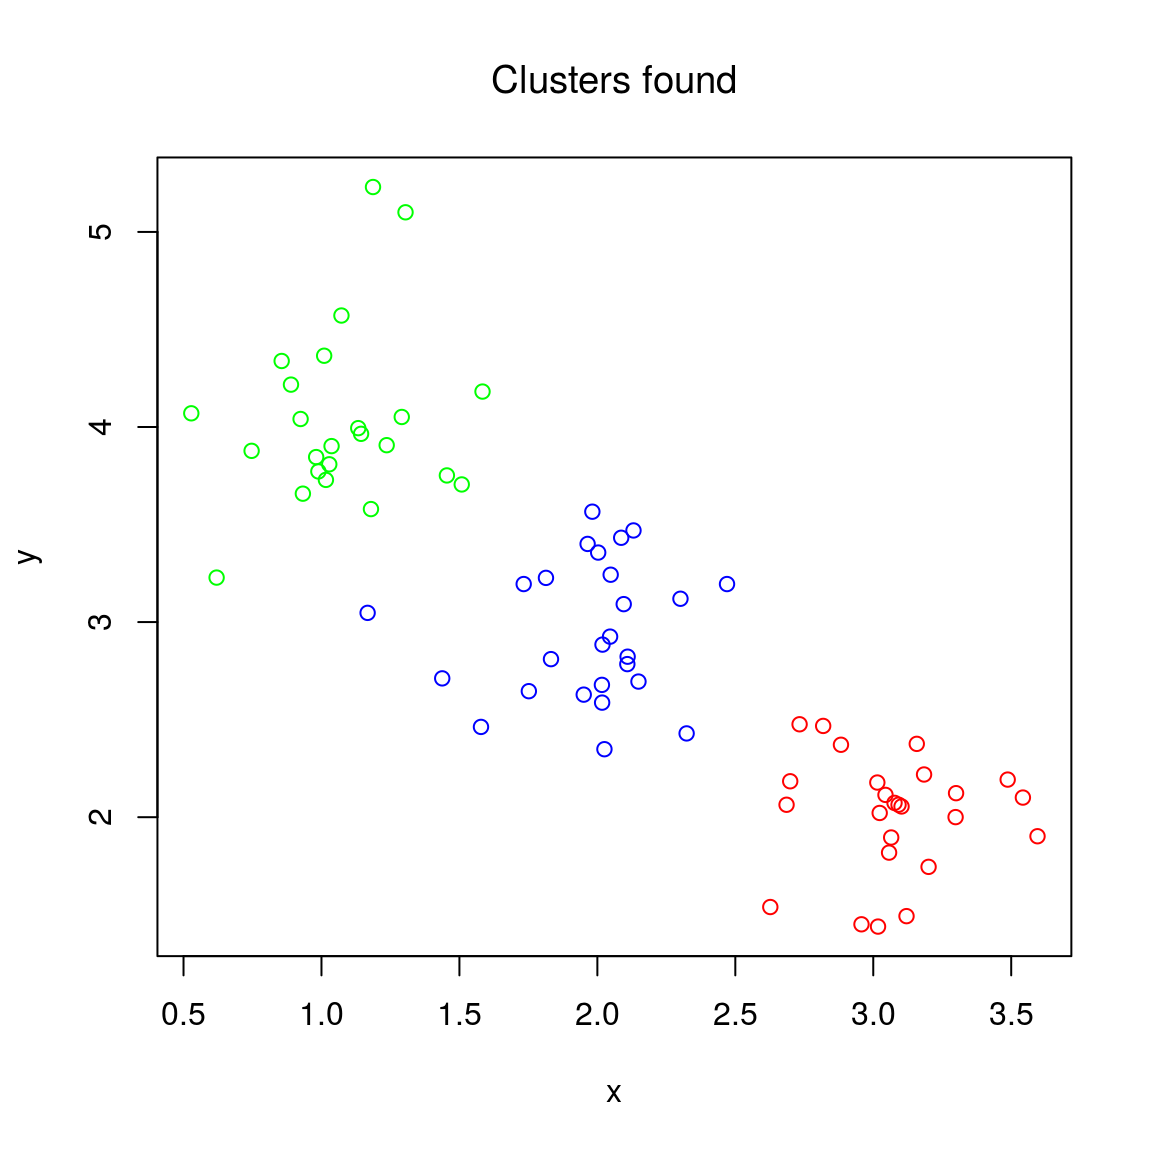
Clustering with fanny
library(cluster)
# ?fanny
The cmeans function does not accept a distance matrix as input, but the fanny function does
(cmeans knows only euclidian and manhattan distance).