Principal Component Analysis
What does PCA do?
- roughly spoken, it shows a 2D (3D) projection of a multidimensional cloud in such a way that the biggest variation is visible
PCA
data(iris)
head(iris)
## Sepal.Length Sepal.Width Petal.Length Petal.Width Species
## 1 5.1 3.5 1.4 0.2 setosa
## 2 4.9 3.0 1.4 0.2 setosa
## 3 4.7 3.2 1.3 0.2 setosa
## 4 4.6 3.1 1.5 0.2 setosa
## 5 5.0 3.6 1.4 0.2 setosa
## 6 5.4 3.9 1.7 0.4 setosaIt is good practice to center and scale the variables prior to PCA.
log.ir <- log(iris[, 1:4])   # log transform
ir.species <- iris[, 5]
ir.pca <- prcomp(log.ir, center = TRUE, scale. = TRUE)
plot(ir.pca, type = "b", col = "red", main="Variance associated with PCs", font.main = 1) 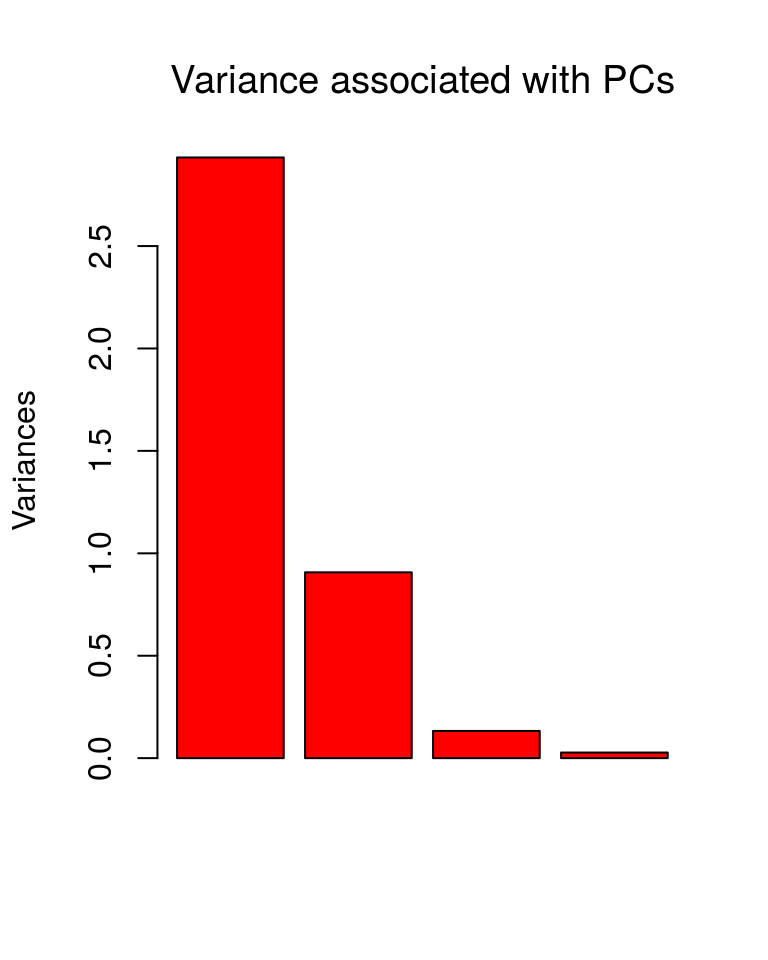
Biplot
biplot(ir.pca, main = "PCA biplot for iris data", font.main = 1, cex = 0.6)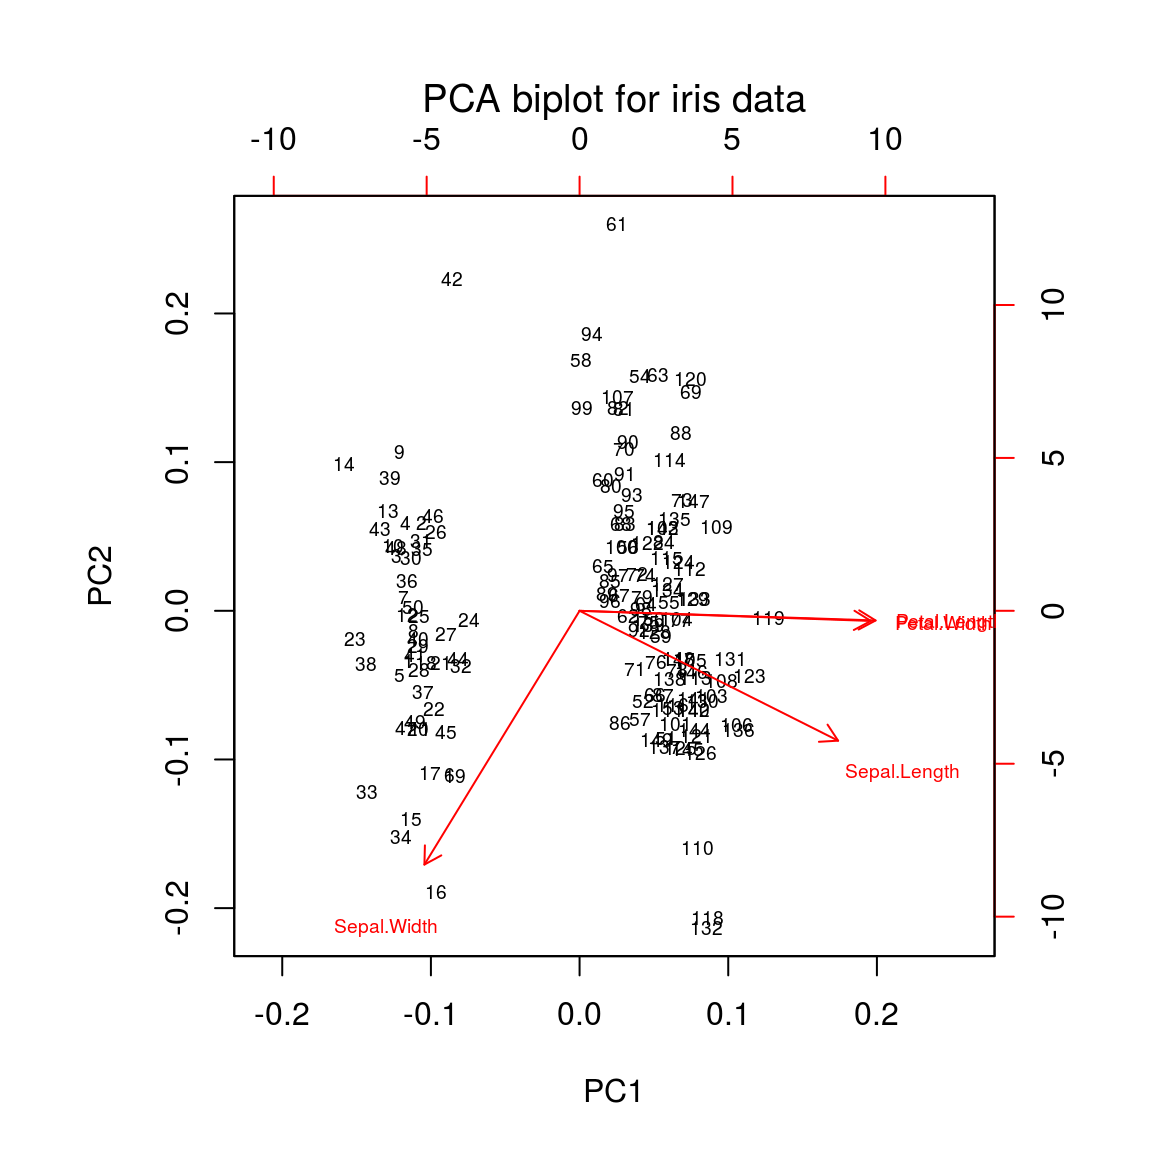
Cosine of the angle between two variables = correlation of these variables
- acute angles: positivly correlated
- obtuse angles: negatively correlated
- right angles: not correlated
If a variable vectors is short:
- the variable is not well represented by the plot (samples nearly orthogonal to the plot)
- not related to other variables
Scatterplot
str(ir.pca)## List of 5
## $ sdev : num [1:4] 1.712 0.952 0.365 0.166
## $ rotation: num [1:4, 1:4] 0.504 -0.302 0.577 0.567 -0.455 ...
## ..- attr(*, "dimnames")=List of 2
## .. ..$ : chr [1:4] "Sepal.Length" "Sepal.Width" "Petal.Length" "Petal.Width"
## .. ..$ : chr [1:4] "PC1" "PC2" "PC3" "PC4"
## $ center : Named num [1:4] 1.755 1.107 1.175 -0.172
## ..- attr(*, "names")= chr [1:4] "Sepal.Length" "Sepal.Width" "Petal.Length" "Petal.Width"
## $ scale : Named num [1:4] 0.141 0.143 0.59 0.983
## ..- attr(*, "names")= chr [1:4] "Sepal.Length" "Sepal.Width" "Petal.Length" "Petal.Width"
## $ x : num [1:150, 1:4] -2.41 -2.22 -2.58 -2.45 -2.54 ...
## ..- attr(*, "dimnames")=List of 2
## .. ..$ : NULL
## .. ..$ : chr [1:4] "PC1" "PC2" "PC3" "PC4"
## - attr(*, "class")= chr "prcomp"plot(ir.pca$x[,1], ir.pca$x[,2])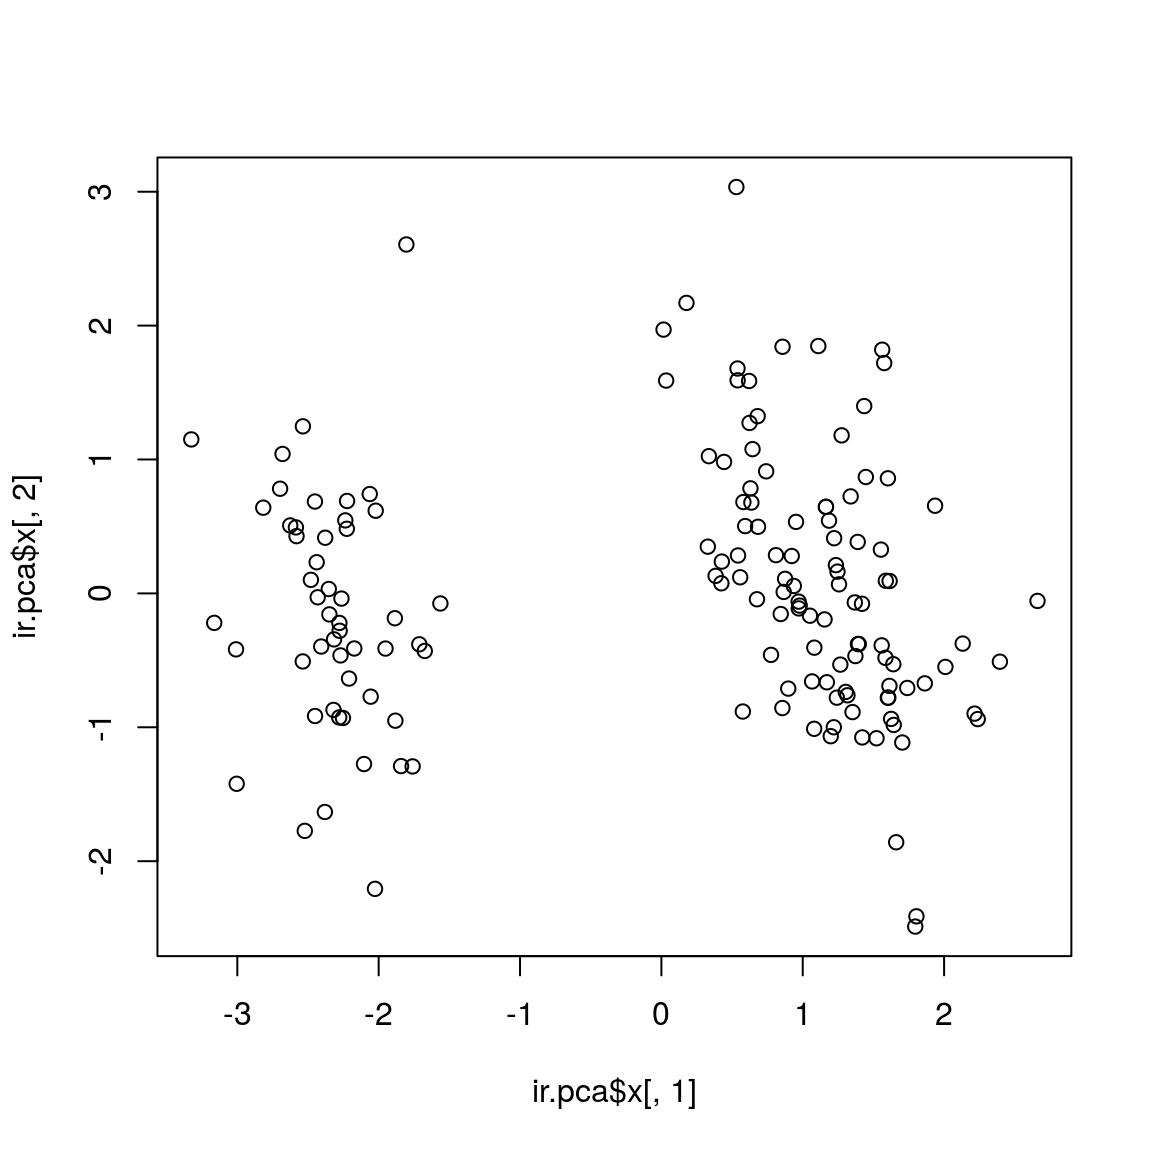
# text(ir.pca$x[,1], ir.pca$x[,2], rownames(log.ir), pos = 1) # to check if this is the correct plotBetter scatterplot
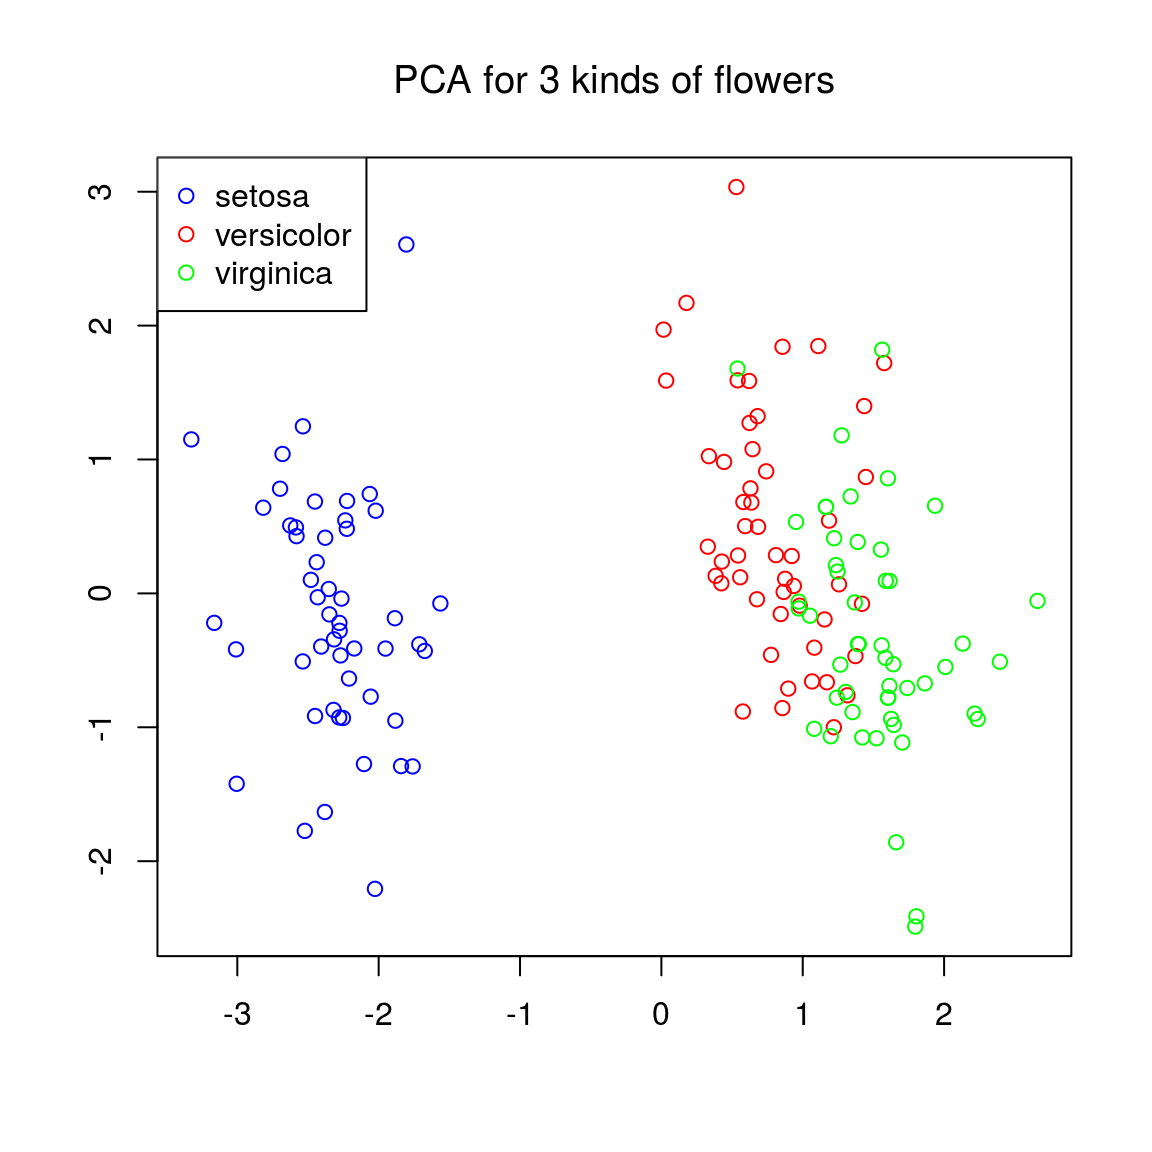
Colouring the points according to species might be a good idea:
class(ir.species)## [1] "factor"levels(ir.species) ## [1] "setosa" "versicolor" "virginica"colvec = rep("black", length(ir.species)) # initialize the color vector
colvec[ir.species == "setosa"] = "blue"
colvec[ir.species == "versicolor"] = "red"
colvec[ir.species == "virginica"] = "green"
maintxt = "PCA for 3 kinds of flowers"
plot(ir.pca$x[,1], ir.pca$x[,2], col = colvec, xlab = "", ylab = "", main = maintxt, font.main = 1)
legend("topleft", c("setosa", "versicolor", "virginica"), col = c("blue", "red", "green"), pch = 1)