The package edgeR
What can `edgeR’ do?
- Gene expression analysis
- edgeR@Bioconductor
- R documentation
- Publication
- examples, Stanford
Loading the library
# source("https://bioconductor.org/biocLite.R")
# biocLite("edgeR")
library(edgeR)
## Loading required package: limmaLoading count data from RNA-Seq
counts = get(load("counts_Hs.RData"))
dim(counts)
## [1] 27704 6range(counts)## [1] 0 899348is.matrix(counts)## [1] TRUEhead(counts)## A1 A2 A3 B1 B2 B3
## ENSG00000101557 2590 2647 3225 3173 3147 3515
## ENSG00000079134 487 488 570 565 663 677
## ENSG00000261724 10 10 14 4 10 9
## ENSG00000158270 13565 14006 16451 9602 9823 10311
## ENSG00000079101 29 23 44 16 20 16
## ENSG00000176912 4 9 5 14 10 20conditions = get(load("conditions_Hs.RData"))
conditions## [1] "10mM" "10mM" "10mM" "0mM" "0mM" "0mM"length(conditions) == ncol(counts) # must be TRUE## [1] TRUElength(unique(conditions)) == 2 # simple analysis: just compare two conditions ## [1] TRUEnr.replicates.group1 = sum(conditions == unique(conditions)[1])
nr.replicates.group1## [1] 3nr.replicates.group2 = sum(conditions == unique(conditions)[2])
nr.replicates.group2## [1] 3Running edgeR
The parameter method=“TMM” means the weighted trimmed mean of M-values (to the reference) proposed by Robinson and Oshlack (2010).
dge <- DGEList(counts = counts, group = conditions, remove.zeros = FALSE)
dge <- calcNormFactors(dge, method = "TMM")
dge <- estimateCommonDisp(dge)
dge <- estimateTagwiseDisp(dge, trend = "movingave")
et <- exactTest(dge)
show.max = nrow(et$table)   # displays all genes
show.max = 10
topHits = topTags(et, n = show.max, adjust.method = "BH", sort.by = "p.value")
test.result.frame = topHits$table
head(test.result.frame)
## logFC logCPM PValue FDR
## ENSG00000260512 12.190325 4.835635 0 0
## ENSG00000153820 10.541393 3.149688 0 0
## ENSG00000152402 10.034181 3.419070 0 0
## ENSG00000020633 9.887362 3.269853 0 0
## ENSG00000125740 -9.339320 7.468802 0 0
## ENSG00000173376 -9.004989 4.476489 0 0nr.up = sum((test.result.frame$FDR <= 0.05) & (test.result.frame$logFC < 0))
nr.up## [1] 3nr.down = sum((test.result.frame$FDR <= 0.05) & (test.result.frame$logFC > 0))
nr.down## [1] 7nr.not.sig = sum(test.result.frame$FDR > 0.05)
nr.not.sig ## [1] 0nr.up + nr.down + nr.not.sig == show.max # must be TRUE## [1] TRUEplotSmear(et)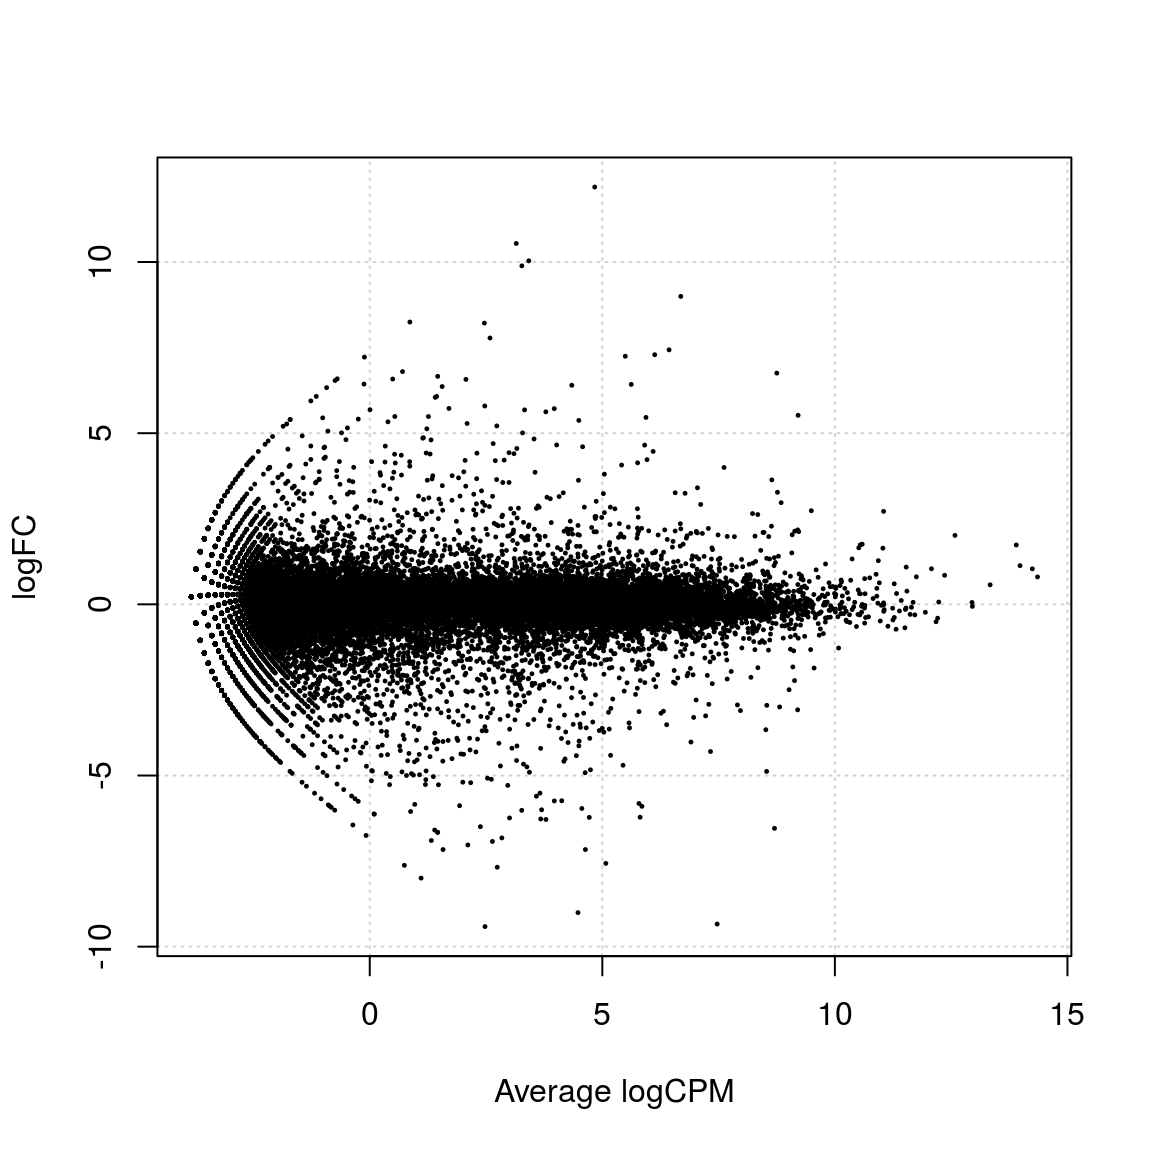
Advanced smear plot
condition1 = unique(conditions)[1]
condition2 = unique(conditions)[2]
maintxt = paste(condition1, "vs.", condition2)
maintxt
## [1] "10mM vs. 0mM"de <- decideTestsDGE(et, p = 0.05, adjust = "BH")
detags <- rownames(dge)[as.logical(de)]
length(detags) # regulated ## [1] 11056plotSmear(et, de.tags = detags, main = maintxt, font.main = 1)
mtext(paste("edgeR: ", length(detags), "DEG's ", nr.up, "up ", nr.down, "down"), side = 3, col = "blue")
abline(h = c(-2, 2), col = "blue") # The horizontal blue lines show 4-fold changes.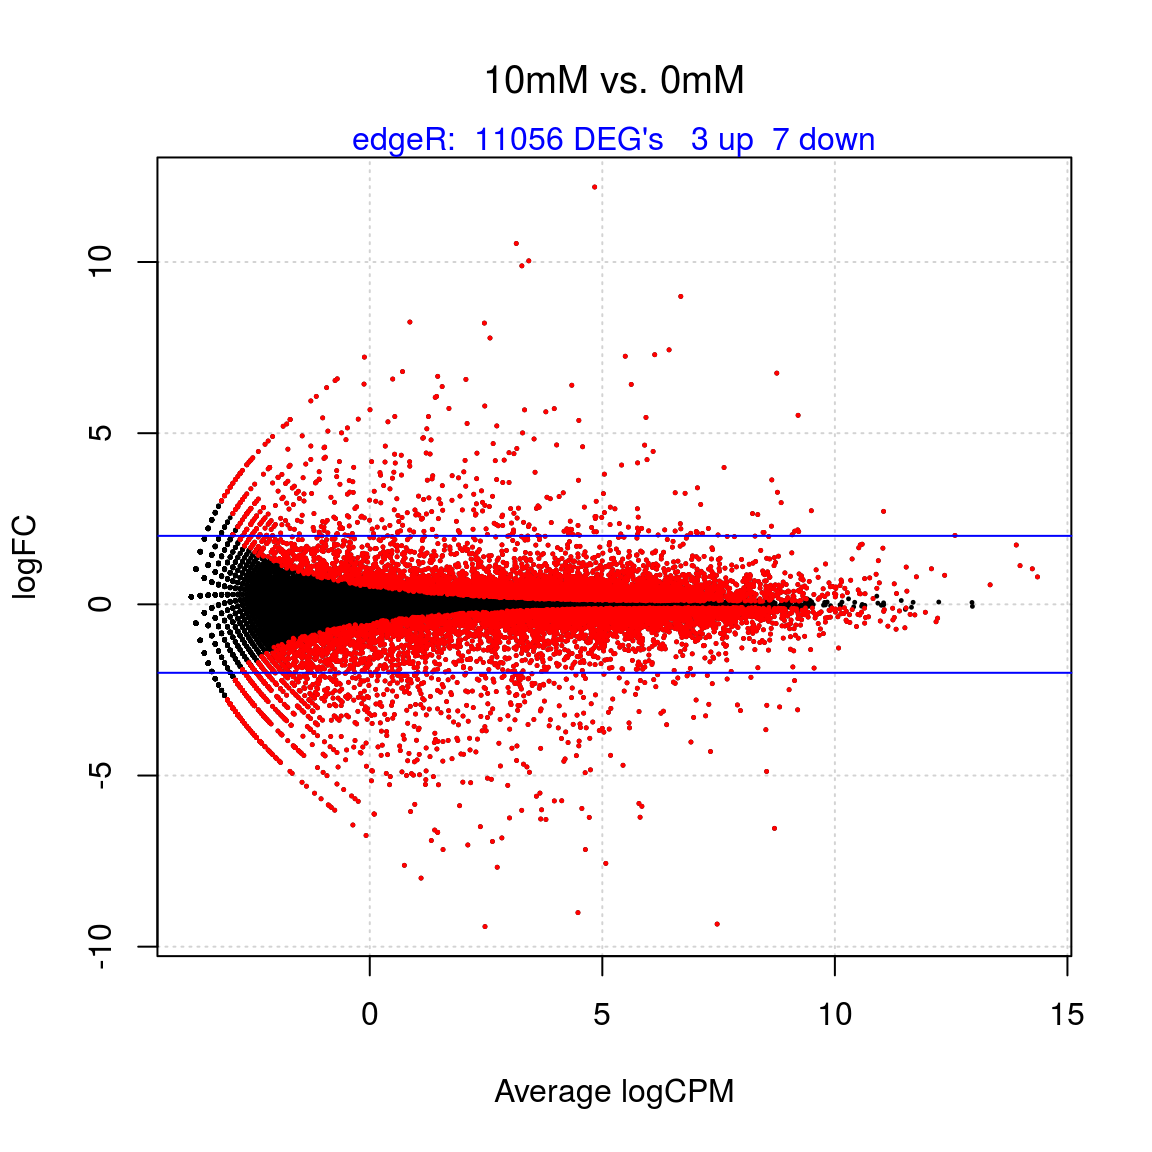
# filename = paste("edgeR.smearplot.", condition1, "--", condition2, ".png", sep="")
# dev.copy(png, file = filename); dev.off()