Scatterplots
sets <- read.table("set1_set2.csv", header=TRUE)    # read from disk and store in variable (object) "sets"
set1 = sets[,1]                                     # 1st column
set2 = sets[,2]                                     # 2nd column
length(set1)
## [1] 300
length(set2)
## [1] 300
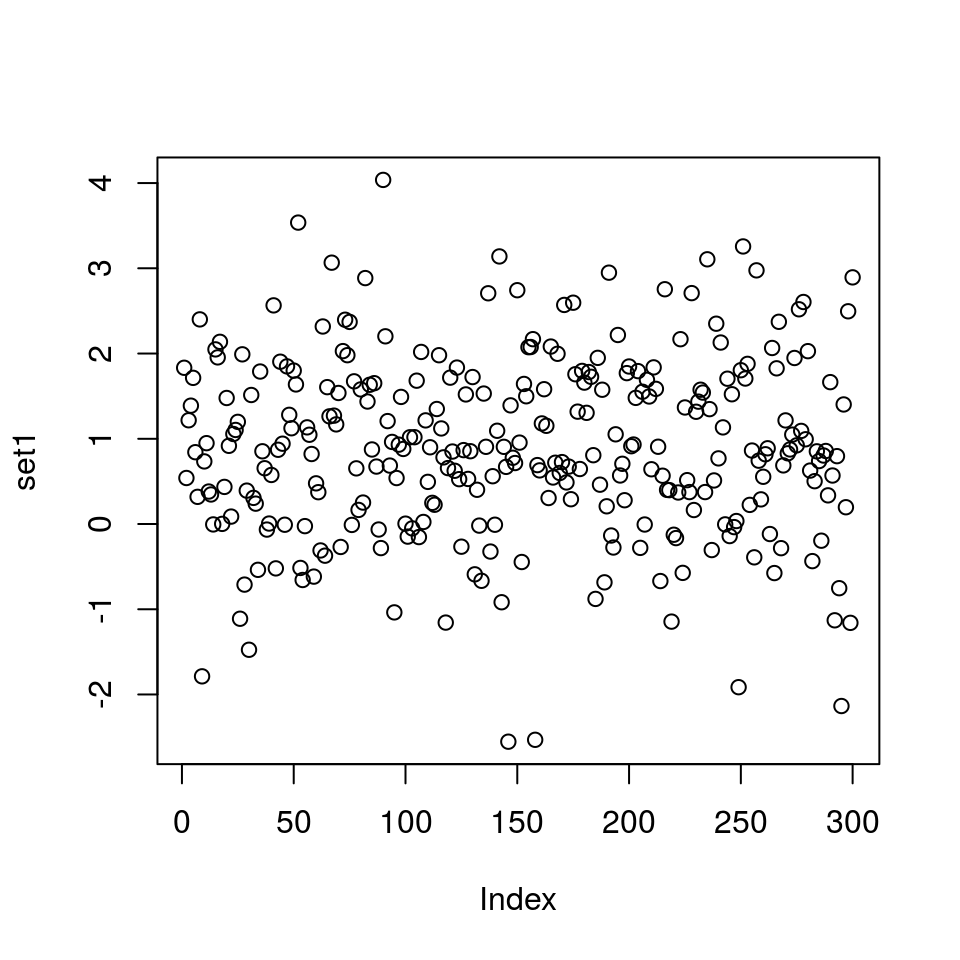
plot(set1) # x-axis: index
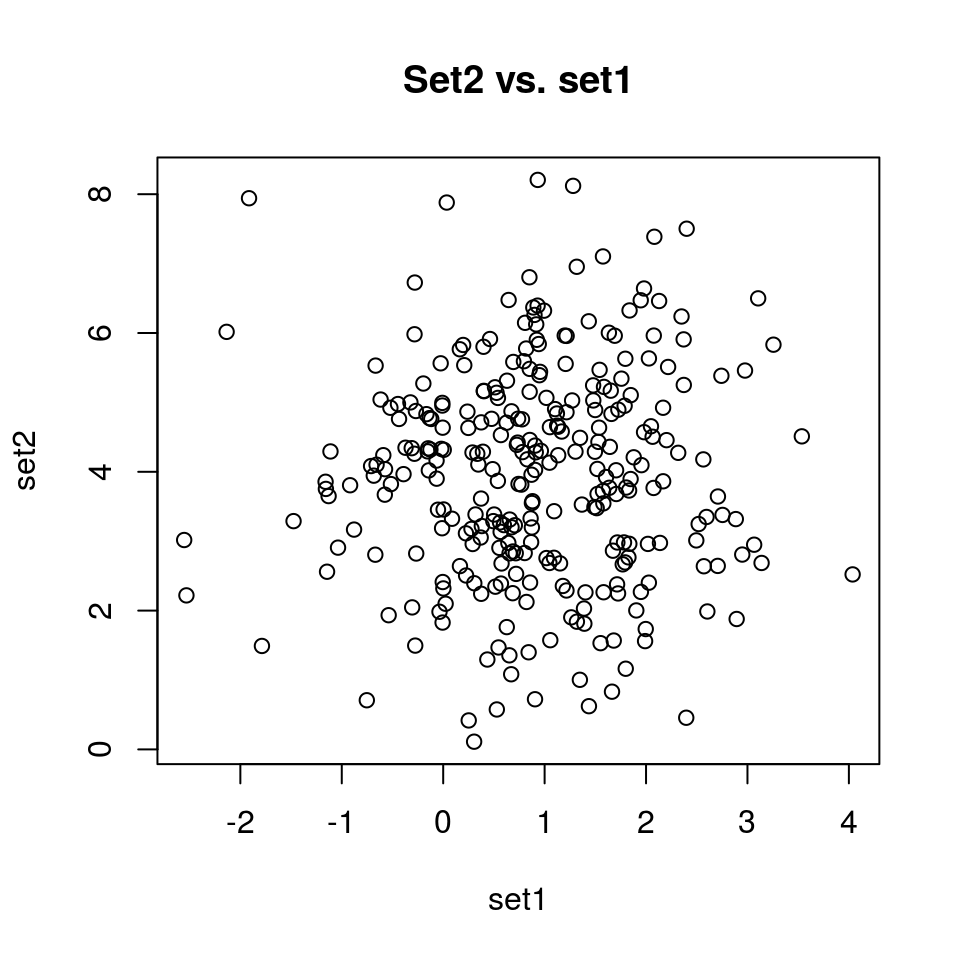
plot(set1, set2, main = "Set2 vs. set1") # set2 vs. set1
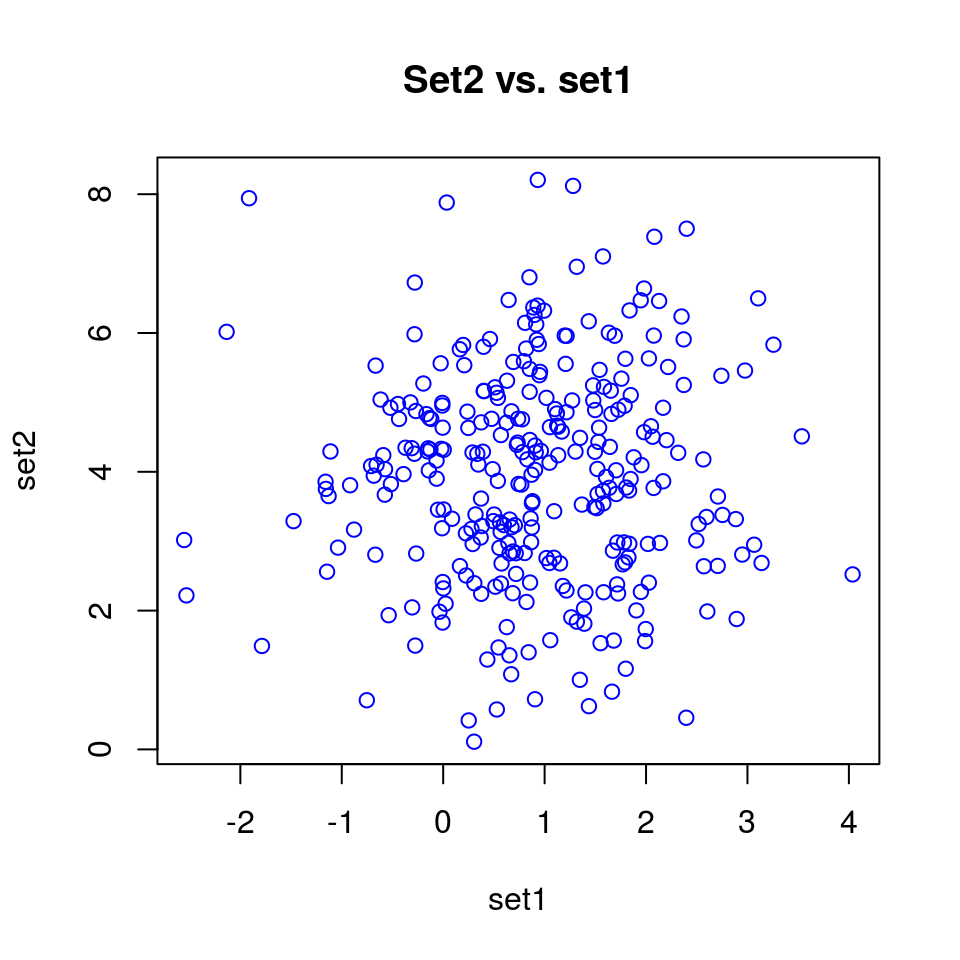
plot(set1, set2, main = "Set2 vs. set1", col = "blue")
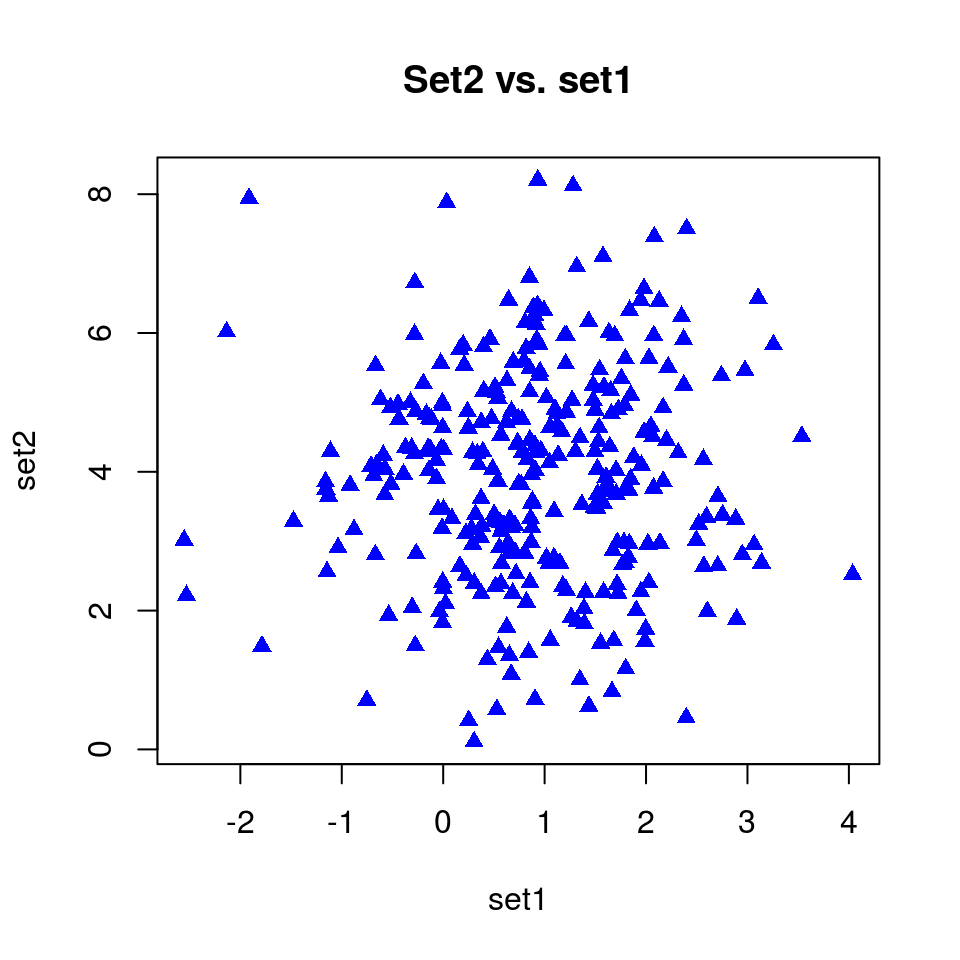
plot(set1, set2, main = "Set2 vs. set1", col = "blue", pch = 17)
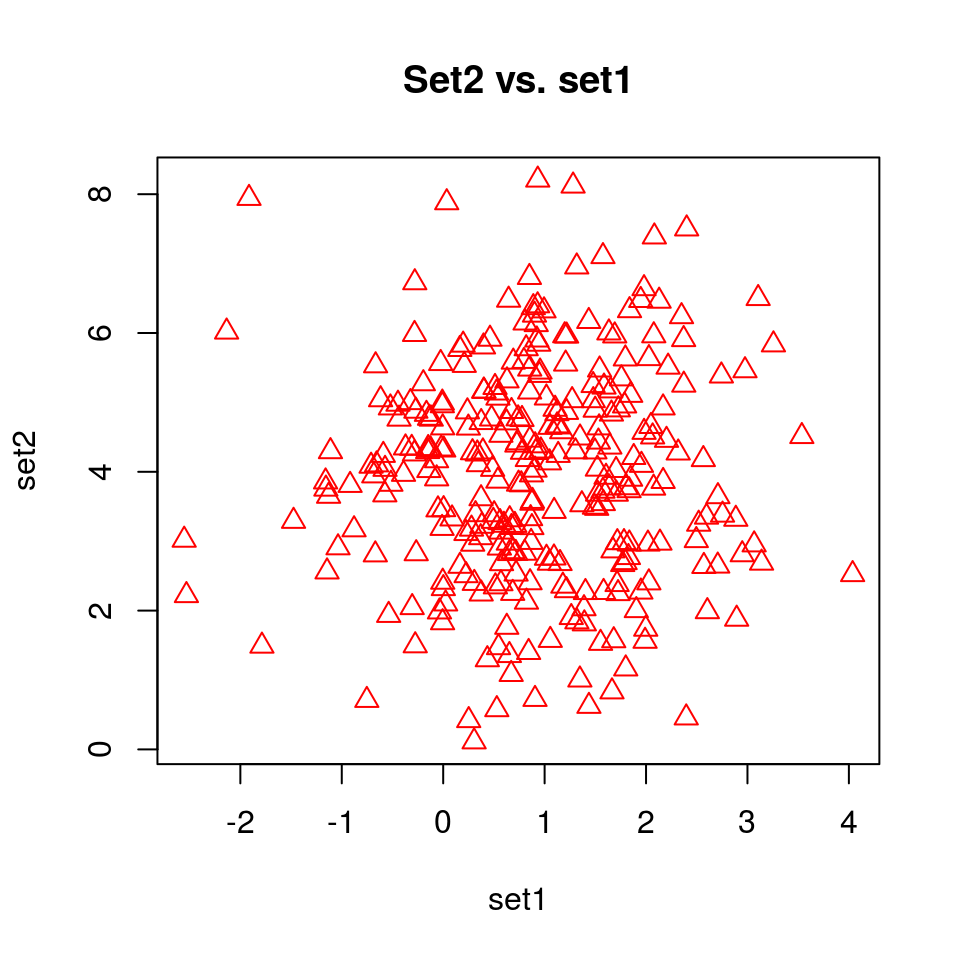
plot(set1, set2, main = "Set2 vs. set1", col = "red", pch = 2, cex = 1.2)
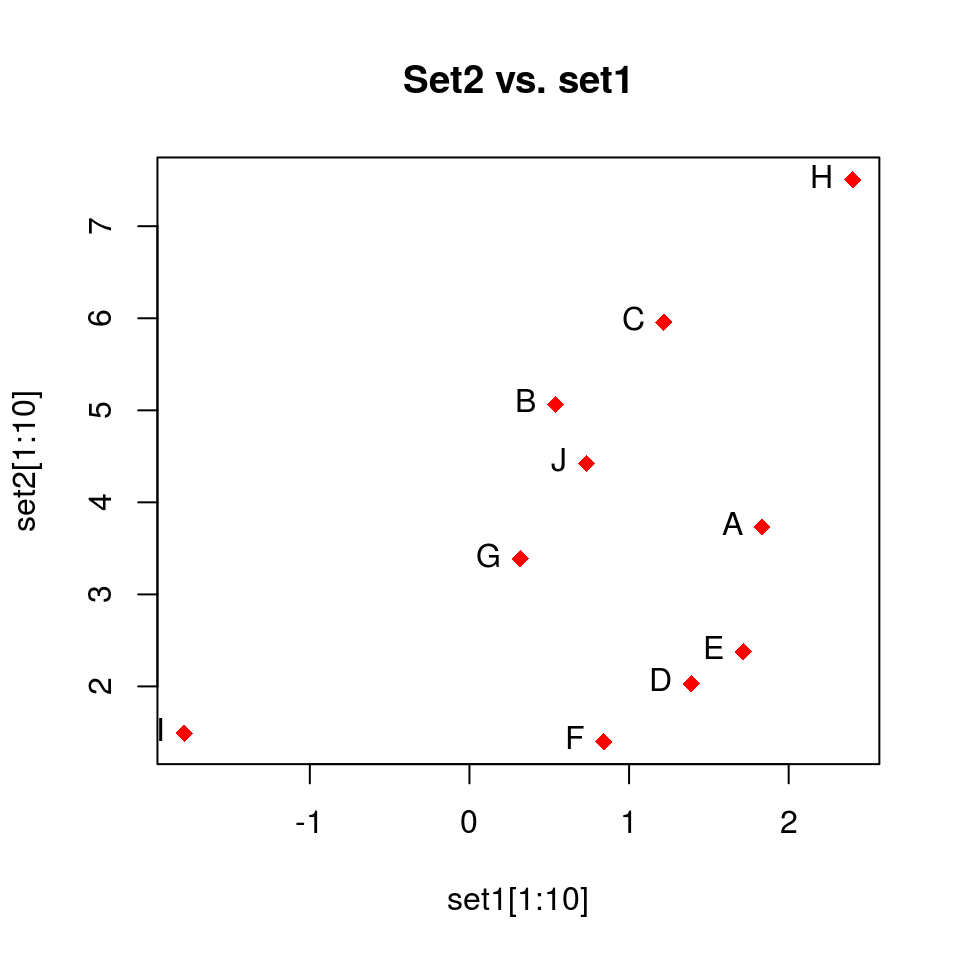
plot(set1[1:10], set2[1:10], main = "Set2 vs. set1", col = "red", pch = 18, cex = 1.2)
text(set1[1:10], set2[1:10], labels = LETTERS[1:10], pos = 2)         # add annotation to the points