Visualization
Violin plots
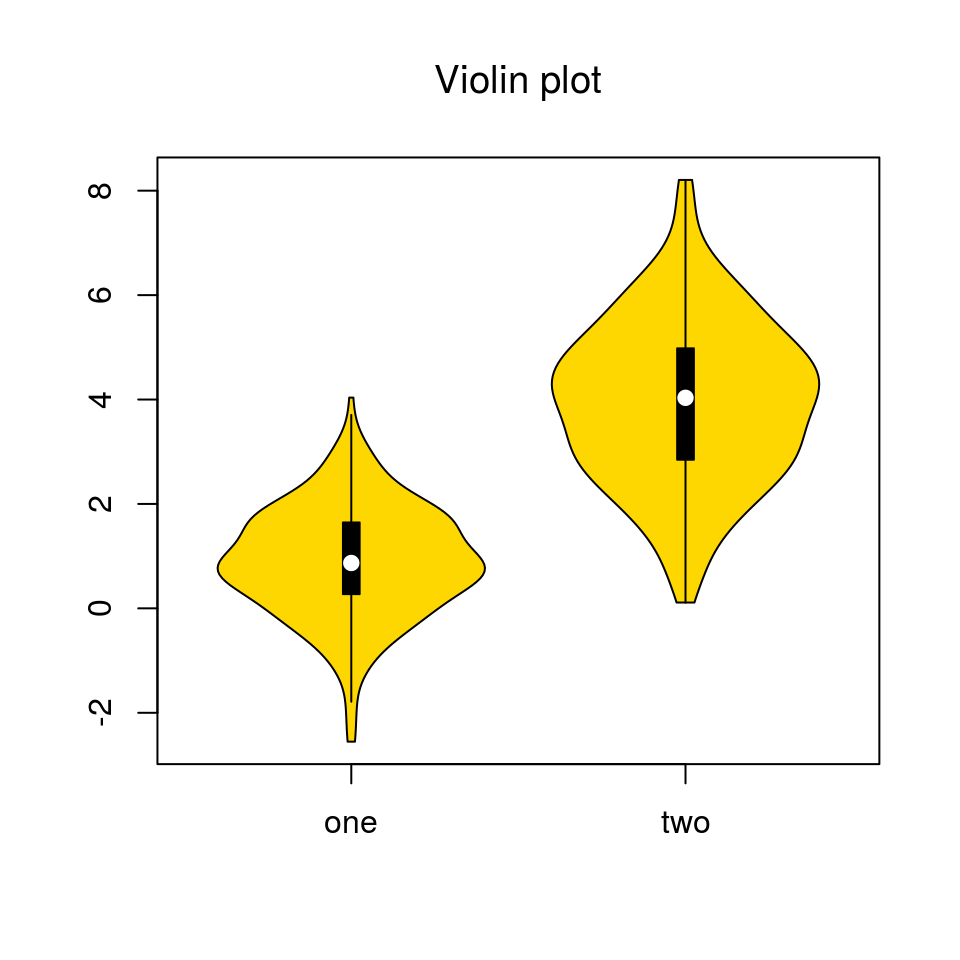
- combination of a box plot and a kernel density plot
- violine is thicker at locations with stronger data support
# install.packages("vioplot")
library(vioplot)
sets <- read.table("set1_set2.csv", header = TRUE)
vioplot(sets[,1], sets[,2], names = c("one", "two"), col = "gold")
title("Violin plot", font.main = 1)